University of Wisconsin Center for Cooperatives
Research on the Economic Impact of Cooperatives
Economic Impacts of Cooperatives
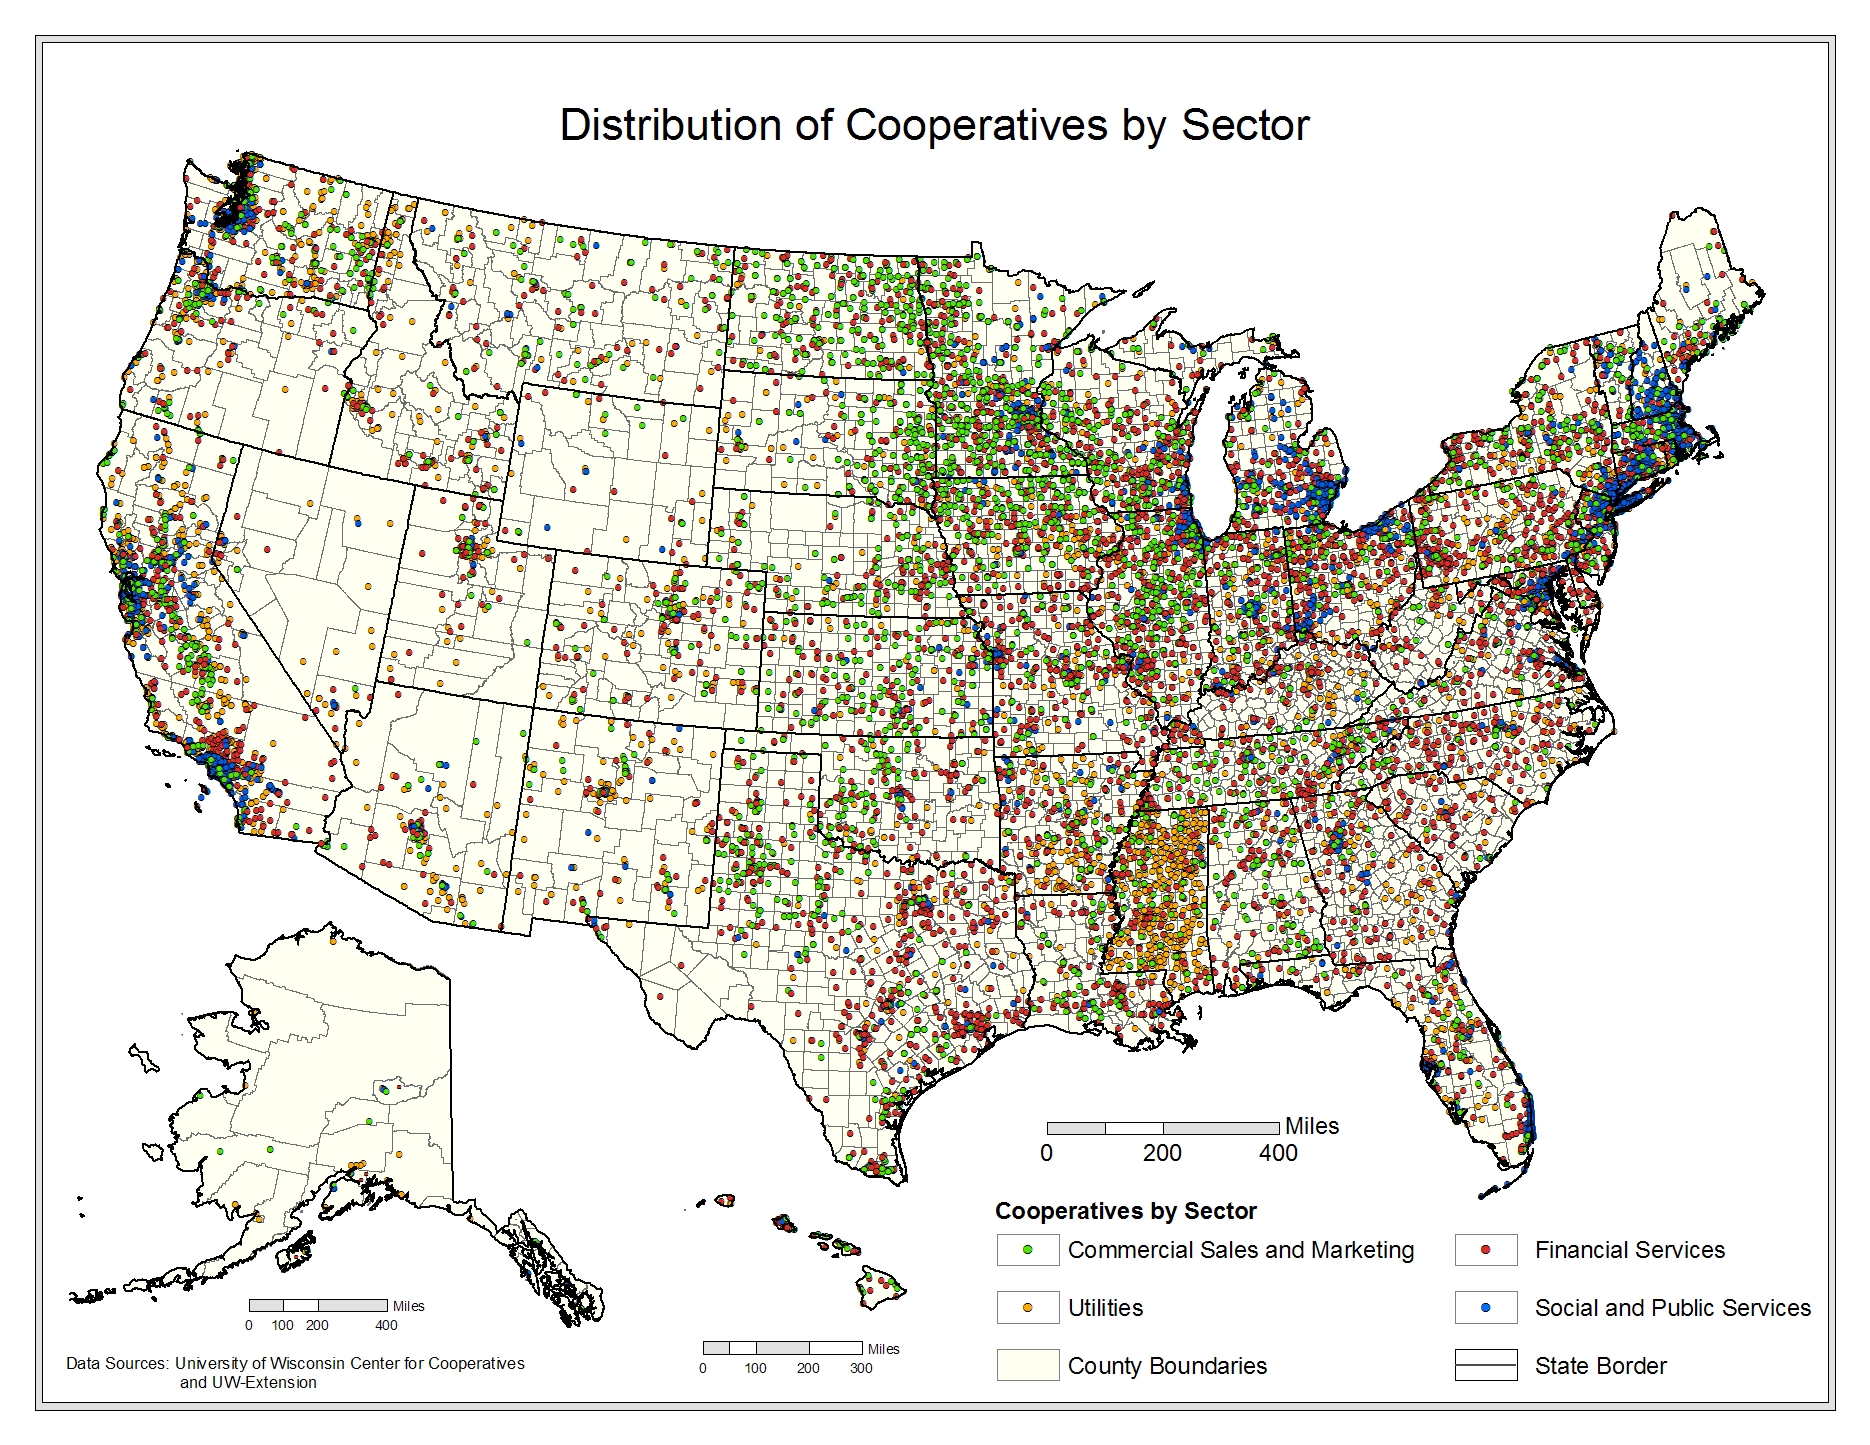
Figure 4-1 displays the 29,284 firms in our census by aggregate sectoral category, with each dot representing a firm's location. Within this universe, we have examined individual firms to verify that patrons have both control rights and the right to residual returns in the organization (i.e., full patron ownership). The Appendix on data collection provides a complete description of our data collection approach and the covered sectors.
Table 4-1 summarizes economic impacts across the four aggregate economic sectors covered in our study. This table is constructed by summing total economic impacts across all subsectors that constitute a given aggregate sector. For example, the Commercial Sales and Marketing aggregate sector is composed of five subsectors: agriculture, consumer goods, arts and crafts, biofuels, and other. Total impacts for each individual subsector have been constructed in five steps.
- Discovery of the universe of firms.
- Base data collection on a sample of firms. Core economic data includes: contact information, wages (including benefits), assets, revenue, membership, patronage refunds, employment, and taxes.
- Extrapolation of sample data to population level. When we did not have data for all firms, we used the average value for each economic indicator across all firms for which we did have data, multiplied by the total number of firms in the subsector. This yielded direct impacts.
- Computation of indirect and induced impacts using the base data and input-output multipliers for each subsector. See our methodology appendix for details.
- Summation of direct, indirect, and induced impacts to yield total impacts.
Accurate data for the housing sector, part of the aggregate Social and Public Services sector, could not be collected for reporting impact analysis. See Housing.
Adding total revenue impacts across the five sectors that make up the aggregate Commercial Sales and Marketing sector yields a total aggregate revenue of $220B and 440,198 jobs. This is produced by 3,463 firms that operate at 5,695 different places of business (establishments). Total income—a measure of value added akin to GDP for the aggregate economy— is $37B and wage impact is $13B. Financial Services is the largest aggregate sector across all measures of impact. This sector includes credit unions, the Farm Credit System, mutual insurers, and a small number of very large financial institutions that provide loan funds to cooperative businesses (or that operate on a cooperative basis with member businesses). The sector with the largest number of firms—Social and Public Services—has the smallest overall impact across all measures. Overall, 29,284 cooperatives that operate at 72,993 places of business (establishments), collectively accounting for nearly $652B in revenue, $154B in income, >$74B in wages, and >2M jobs.
| Sector | Revenue | Income | Wages | Employment | Firms | Estab. | |
|---|---|---|---|---|---|---|---|
| (million dollars) | (jobs) | ||||||
| Commercial Sales and Marketing | 201,207 | 37,737 | 13,810 | 422,505 | 3,463 | 5,695 | |
| Social and Public Services | 7,525 | 2,213 | 1,690 | 424,505 | 11,311 | 11,311 | |
| Financial Services | 394,363 | 100,661 | 51,176 | 1,133,353 | 9,964 | 50,330 | |
| Utilities | 49,808 | 13,392 | 8,292 | 162,873 | 4,546 | 5,657 | |
| Total | 652,903 | 154,002 | 74,969 | 2,143,236 | 29,284 | 72,993 | |
| 1 Analysis does not include housing cooperatives. | |||||||