Financial service cooperatives are composed of credit unions [1], banks within the farm credit system [2], mutual insurance companies [3], and a variety of financing organizations [4] that lend to cooperative firms and banks. Table 4-4 shows that 8,627 of the 50,330 financial service cooperatives in the U.S. provided us with data. These "reporting" cooperatives account for $2.8T in assets, $265B in revenue, 376,000 jobs and $13B in wages. There are 325 million members, which as we noted previously, grossly overstates the total number of unique members within this aggregate sector. For example, many of the 91 million credit union members are also likely members of a mutual insurer.
The Cooperative Finance [4] subsector accounts for the largest share of assets within the Financial Services economic sector, followed by mutual insurance companies [3], credit unions [1], and the farm credit system [2]. Credit unions [1] and mutual insurance [3] companies account for the largest number of firms, establishments, memberships, and employees.
We report only on firms for which we have collected economic data (some firms did not respond to our requests for information), so that these numbers represent lower bounds regarding the full economic footprint of cooperatives in this aggregate sector. As we described in the previous section, we extrapolated to the full population for our impact analysis. As a consequence, the sum of direct impacts in the following subsections will be larger than the corresponding aggregate variables reported here.
| Economic Sector | Reporting | Total | Estab. | Assets | Revenue | Wages | Employees | Memberships | |||
|---|---|---|---|---|---|---|---|---|---|---|---|
| (firms) | (million dollars) | (thousands) | |||||||||
| Credit Unions | 8,334 | 8,334 | 29,029 | 760,971 | 40,218 | 9,421 | 236.55 | 91,537 | |||
| Farm Credit System | 104 | 104 | 1,497 | 186,451 | 11,884 | 1,009 | 11.17 | 401 | |||
| Mutual Insurance | 148 | 1,497 | 19,761 | 842,340 | 140,038 | 1,893 | 122.17 | 232,969 | |||
| Cooperative Finance | 41 | 43 | 43 | 1,072,196 | 72,691 | 757 | 6.25 | 27.891 | |||
| Total | 8,615 | 9,978 | 50,330 | 2,861,958 | 264,831 | 13,080 | 376.14 | 324,935 | |||
 [5]
[5]Credit unions play an important role in consumer banking by offering financial services to nearly one-third of all Americans, with 86.8 million memberships. Compared to all depository institutions, credit unions are relatively small with <10% of the U.S. market (National Credit Union Administration (NCUA) Annual Report, 2007 [6]). Roughly 75% of credit unions have total assets <$100M, while 80% of commercial banks and 85% savings institutions have assets >100M. Less than 2% of credit unions have assets >$1B (U.S. Central, 2007 [7]). Credit unions, like commercial banks and thrifts, are both Federal and state government chartered. There are currently 5,036 federally chartered credit unions (FCUs) holding $418B in assets and 3,157 state chartered credit unions (SCCUs) holding $336B in assets (NCUA Statistics, 2007 [8]).
Like all other financial depository institutions, credit unions take deposits and offer loans to its consumer base. While credit unions resemble banks, they have several distinctive legal differences: they are not-for-profit cooperatives with an IRS tax exemption status. They return earnings to their membership in the form of reduced fee (interest) on loans and increased interest (dividends) on deposits, or they may re-invest earnings into the credit union. Traditionally credit unions were formed with stringent membership criteria based on a "common bond" such as employment, association, religious, or community organization (Frame, 2002 [9]). Following Federal legislation in 1977, credit unions expanded their services to include share certificates and long-term mortgage lending, making them competitive in the financial sector. Some credit unions may be designated "low-income credit unions" by the National Credit Union Administration, or, in some instances, a state regulatory agency. This designation allows the credit union to accept non-member deposits and secondary capital in order to better serve its membership and community. Many of these low-income designated credit unions serve narrow fields-of-membership, such as groups of employees.
The model for modern credit unions was developed in Germany in the mid-19th century. Influenced by the example and principles of the Rochdale Pioneers in England, these credit cooperative societies spread quickly in Europe. The first credit union in the U.S. opened in 1909, in Manchester, New Hampshire, and by 1920 there were credit unions in New York, North Carolina, and Massachusetts. They provided credit for consumer purchases, and opportunities for savings. The prosperity of the 1920s created a strong demand for credit, and many states approved statutes permitting the organization of credit unions. Strong leadership led to the development of state credit union leagues, which supported the growth of the emerging industry.
By 1929, 32 states had credit union legislation, and 1,100 credit unions had been formed. In 1934, the Federal Credit Union Act was passed, which permitted the formation of federally chartered credit unions in states that did not have a credit union law. This precipitated the formation of thousands of additional credit unions during the 1930s. Most credit unions were formed in work places, or sponsored by membership organizations or churches. These early credit unions depended on a network of volunteers who served on the board and often ran the credit unions. As the industry developed, it became more professional and also created strong support institutions. Credit unions formed a self-funded share insurance fund, a mutually owned credit insurance company (Credit Union National Association (CUNA), 2007 [10]), and cooperatively owned central banking services [4] (state or regional corporate credit unions and U.S. Central Federal Credit Union). These organizations have supported a significant expansion of consumer services. Since the 1970s, many credit unions have repositioned themselves to serve as full service financial institutions for their members.
Credit unions are organized in a three-tiered system. At the top isU.S. Central [11], a wholesale credit union, that provides support and financial services to corporate credit unions (CCUs) [12]. CCUs occupy the middle tier and provide financial services to 8,834 natural person credit unions. All three tiers of the system are governed by the NCUA [13], which is comprises a three-member board appointed by the President and confirmed by the Senate. NCUA [13] authorizes all federally chartered credit unions, while individual states charter those subject to state regulation. Most SCCUs have parity power clauses that allow individual SCCUs to adopt Federal credit union rules if they are more progressive. Currently, no laws permit the chartering of SCU's in Delaware, Dakota and Wyoming.
All FCUs and 95% of SCCUs are insured by the National Credit Union Share Insurance Fund (NCUSIF) [14], which was voluntarily capitalized by individual credit unions and is backed by the "full faith credit" of the U.S. government. Credit unions participate by investing 1% of their savings which NCUSIF uses to invest, cover expenses and rescue failed credit unions. Members deposit accounts are insured by NCUSIF for $100K. American Share Insurance (ASI) [15]insures the remaining 165 SCCUs. In the late 1970s, Congress created two member-owned supporting organizations: the Central Liquidity Fund (CLF), which can borrow up to 12 times its capital stock and surplus, and the Corporate Development Revolving Fund (CDRF). The CRDF with Congressional appropriations and interest has grown to $16.7M. The CLF's primary purpose is to serve as a lender of last resort and to provide liquidity to its members during times of economic volatility. The CDRF provides support to low income credit unions through technical assistance grants and loans.
Trade associations such as CUNA [16], the Association of Corporate Credit Unions (ACCU) [17], the National Association of Federal Credit Unions (NAFCU) [18], the National Association of State Credit Union Supervisors (NASCUS) [19], and the National Federation of Community Development Credit Unions [20], provide legislative and regulatory advocacy for credit unions.
All data for the credit union system are available from the NCUA [13] website, annual reports from individual corporate credit union, and the U.S. Central Federal Credit Union [11] website. For the purposes of this analysis, we used 2007 data.
Table 4-4 shows that the 8,344 credit unions account for $760B in assets and $40B in revenue, and pay >$9B in wages. There are nearly 100 million credit union memberships and 237,000 employees. As Table 4-4.1 shows, by adding indirect and induced impacts to this activity, credit unions account for close to $75B in revenue, close to 500,000 jobs, $20B in wages paid, and >$42B in valued-added income.
| Economic Impact | Multiplier | Units | Direct | Indirect | Induced | Total | |
|---|---|---|---|---|---|---|---|
| Revenues | 1.868 | million $ | 40,088 | 15,579 | 19,215 | 74,882 | |
| Income | 1.764 | 23,961 | 7,823 | 10,486 | 42,270 | ||
| Wages | 2.144 | 9,421 | 4,854 | 5,927 | 20,201 | ||
| Employment | 1.994 | jobs | 236,459 | 94,502 | 140,588 | 471,549 | |
 [21]
[21]
 [22]
[22]
 [23]
[23]
 [24]
[24]
Absence of rural credit led to the creation of the Farm Credit System (FCS) [25] in the early 1900s. The system is a cooperatively owned government-sponsored entity (GSE) with an explicit mandate to serve agricultural borrowers. Today the system continues to be a dominant source of long-term farm debt, which has grown from 20% of real estate farm debt in 1960 to 40% in 2006 (USDA, 2006 [26]). Its consumer base includes farmers, ranchers, producers of aquatic products, agricultural cooperatives, select rural communications and energy companies, rural homeowners, and other eligible entities.
The FCS [25] differs from other financial institutions in that it is a pure lender and finances its agricultural lending through the issuance of financial securities. As of 2007, the FCS [25] accounted for 37% of total farm debt with 42% in real estate and 31% in non-real estate activities. In addition to extending dependable credit, the FCS [25] promotes competition by expanding its financial menu to include services such as consulting, estate planning, record keeping, crop insurance, credit and mortgage life insurance, disability insurance, tax preparation, and cash management. Today private financial institutions also offer financial services to the agricultural sector. Collectively the private sector accounts for 60% of total farm debt, 54% in real estate and 65% in non-real estate debt.
Since its inception during the Roosevelt administration, the FCS [25] has undergone several rounds of restructuring. In 1916, the Federal Farm Loan Act established a credit delivery system to the agricultural sector by creating Federal Land Banks (FLBs) in 12 regions of the U.S. These land banks provided funds to regional banks and associations so that they could provide long-term mortgage financing to farmers. During the Great Depression, the Farm Credit Act of 1933 was enacted to bolster agricultural production by funneling short-term credit through 12 Production Credit Associations and 13 Banks for Agricultural Cooperatives. Simultaneously, the Emergency Farm Mortgage Act was mobilized to refund the FLBs as an aid package to farmers facing foreclosures and debt defaults. All credit agencies were consolidated into the Farm Credit Administration [27] in 1987.
Until the 1980s, banks took care of the lending needs of a specific geographic district and the associations operated within a geographic district. The FCS [25] underwent major reorganizing in response to the farm financial crisis of the 1980s. The three main contributing factors for the farm debt crisis of 1985 were falling commodity prices, falling farm land values, and an increasing farm debt-to-asset ratio (Harl, 2005 [28]). The impact on the system was significant with record losses, increased accumulation of farm property, and increased amounts of high-risk loans. The Agricultural Act of 1987 brought about significant reorganizing: (1) The Farm Credit Administration (FCA) [27] became an independent arm's length regulator of the FCS with increased enforcement powers; (2) the Farm Credit System Insurance Corporation [29] was created, and (3) the Farm Credit System Financial Assistance Corporation [30] was created with the mandate to re-capitalize FCS [25] institutions in financial distress. Today the FCS [25] is composed of 99 lending associations and banks.
Agriculture in the U.S. is a capital-intensive industry where investments in farmland, machinery, equipment, livestock breeding, storage facilities, etc. require long-term financing. Carrying 40% of the total long-term real estate debt and 37% of total farm debt (as of 2007), the FCS [25] undoubtedly is a prominent player in agricultural credit markets. While commercial banks have established themselves as the main competitors for rural credit, it is hard to make the case that rural credit markets in the U.S. are fully competitive (USDA, 1997 [31]). The FCS [25] has access to relatively easy supply of loanable funds borrowed at rates close to the US treasury rate. It is well positioned to absorb the growing demand for agricultural credit given its ability to lend directly to farmers or to farmer cooperatives.
All the banks and associations are federally chartered and have tax-exempt status. The income earned by FLBs and FLBAs are exempt from Federal, state, and municipal/local taxes, securities, and other debt obligations are exempt from all but Federal income tax. General oversight for the system is provided by the Farm Credit Administration [27], which regulates the system and is composed of a presidentially nominated board. The Farm Credit System Insurance Corporation [29] acts as the insurer, and the Farm Credit Council [32], a trade association, advocates for the system. Organizationally, the FCS is composed of two distinct entities: banks and associations and currently has 94 affiliated lending associations and five banks.
The five banks are AgFirst [33], AgriBank [34], Texas [35], and U.S. AgBank [36] (Farm Credit Banks, FCBs) and CoBank [37] (an Agricultural Credit Bank, ACB). The primary function of the banks is to extend credit to its affiliated associations and, to a lesser extent, extend credit to other eligible financial institutions that carry agricultural credit as part of their loan portfolio. CoBank [37] differs from other banks in the system in that it loans directly to agribusiness cooperatives, rural communication, rural electricity, and rural water and waste, and provides international credit promoting US agricultural commodity exports.
Two types of associations: 85 Agricultural Credit Associations (ACAs) [38] and nine Federal Land Credit Associations (FLCAs) [39] comprise the system. The ACAs extend credit for production and intermediate purposes, agribusiness loans, and rural residential real estate loans, while the FLCAs provide credit only for real estate mortgage lending.
Each bank and association of the Farm Credit System is its own cooperative, and thus has its own member-elected board of directors. Each institution is required to have a nominating committee to select potential candidates and the board must consist of at least 60% member-elected directors. Additional restrictions on board composition include: one outside director (the larger banks and associations require two outside directors), one board member who is a qualified financial expert, and audit and compensation committees.
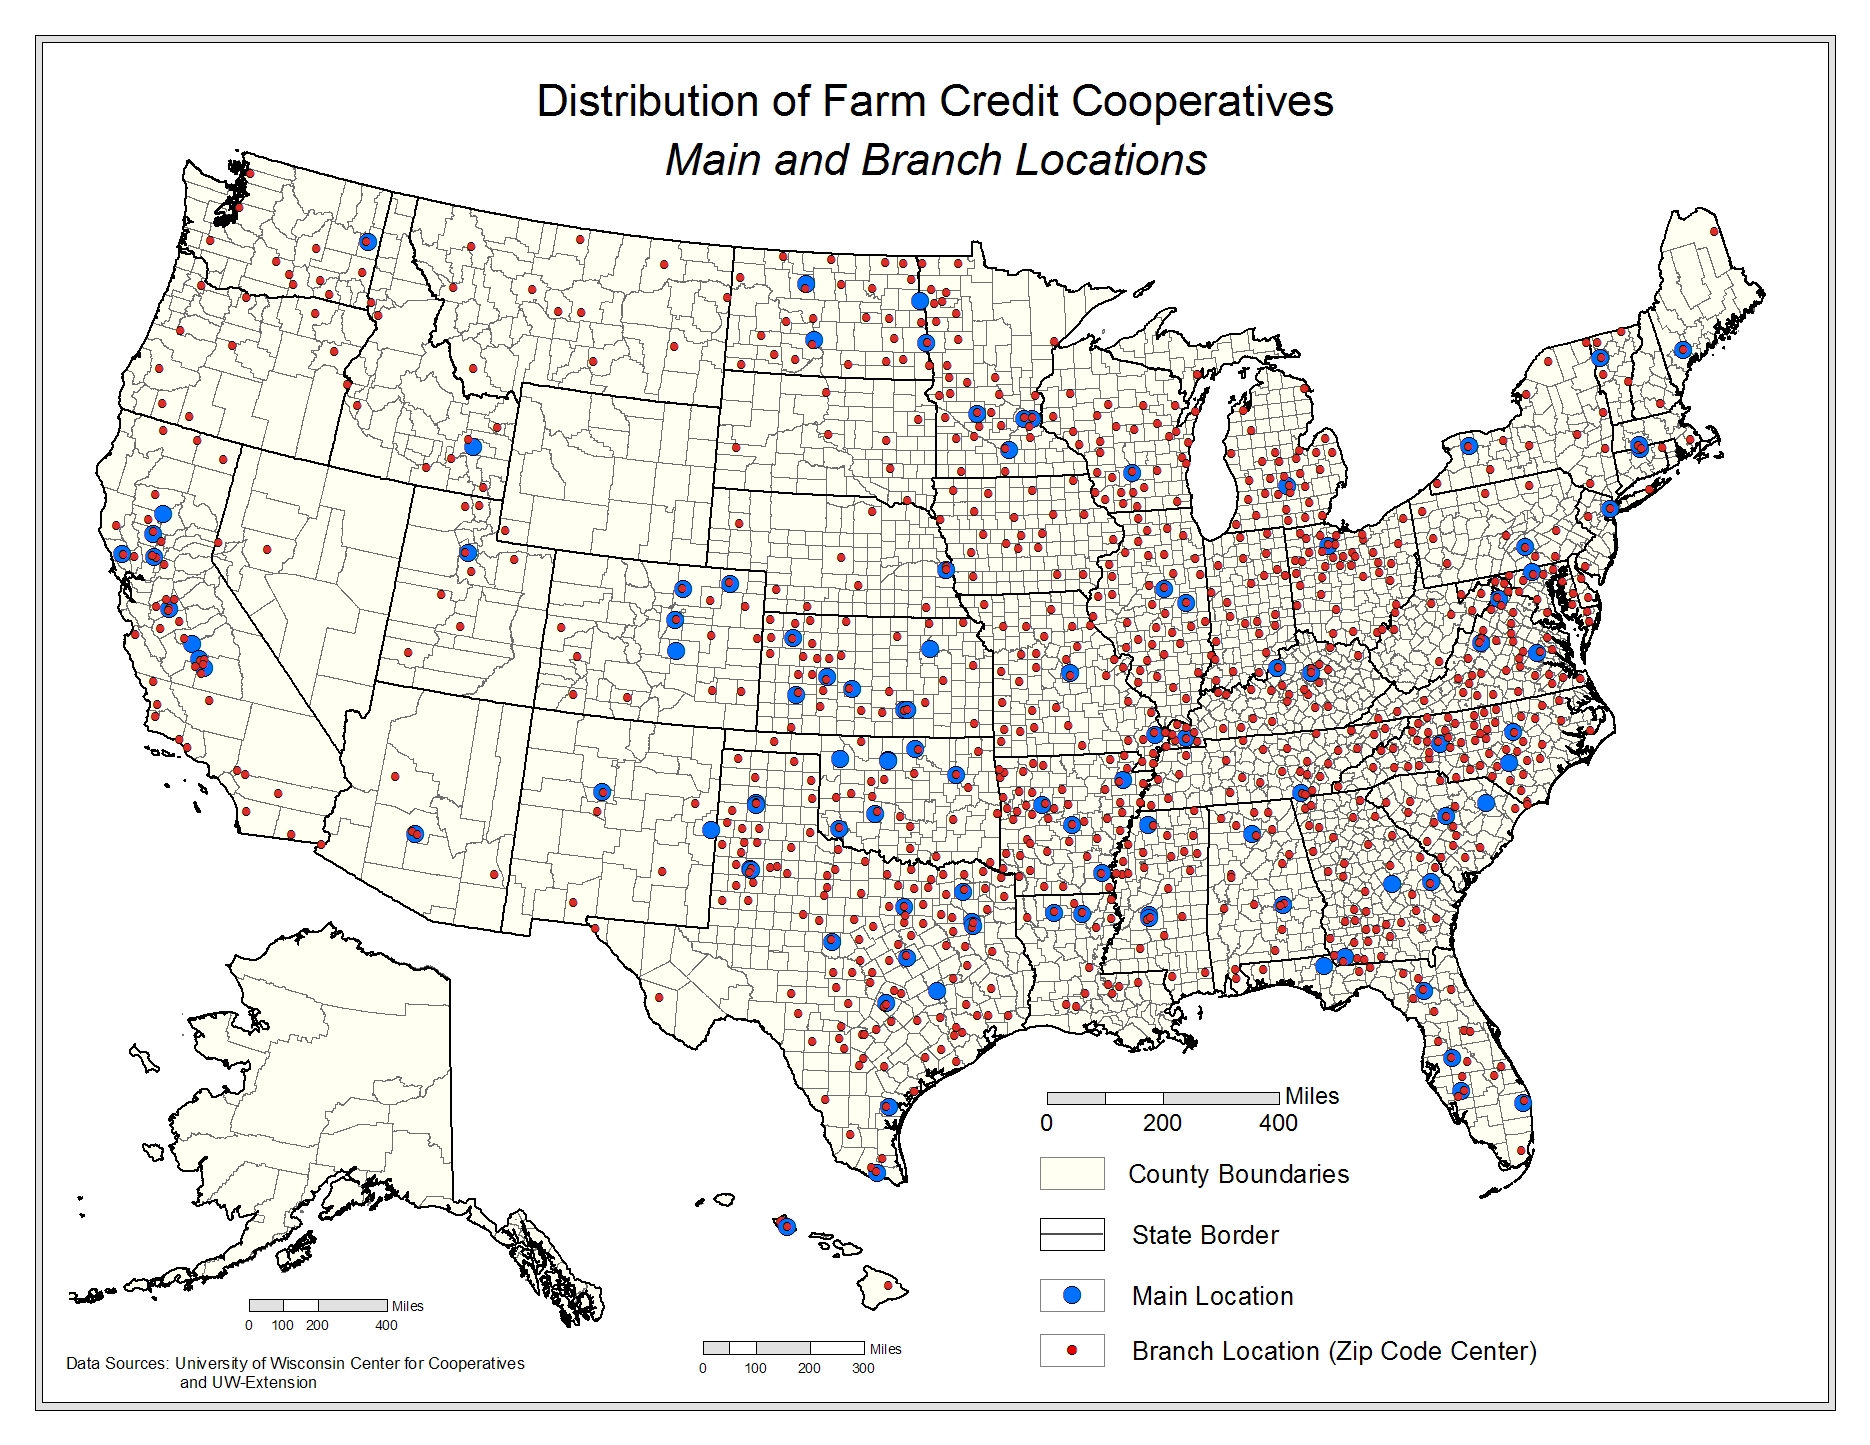
The Farm Credit Administration [27]maintains quarterly financial data at their website. Employment data and branch-level data was collected by the UWCC. The most recent year for which data are available is 2007. We relied on a combination of primary data (branch, and employment numbers at the branch level) and the FCAs [27] quarterly report data for reporting the summary statistics. The economic impact data was obtained from the 2007 FCA report.
Table 4-4 [40] summarizes our data for the farm credit sector. The sector has >$186.4B in assets, close to $12B in sales revenue, and >$1B in wages in benefits pay. There are approximately 400,000 memberships and 15,000 employees. Adding direct and indirect impacts to this activity, Table 4-4.2 shows that farm credit cooperatives account for >$15B in revenue, >13,000 jobs, $2.1B in wages paid, and >$4B in valued-added income.
| Economic Impact | Multiplier | Units | Direct | Indirect | Induced | Total | |
|---|---|---|---|---|---|---|---|
| Revenues | 1.294 | millions $ | 11,884 | 1,540 | 1,958 | 15,382 | |
| Income | 1.756 | 2,446 | 780 | 1,068 | 4,295 | ||
| Wages | 2.078 | 1,009 | 484 | 604 | 2,097 | ||
| Employment | 3.126 | jobs | 11,173 | 9,429 | 14,326 | 34,929 | |
 [41]
[41]
 [42]
[42]
Insurance is a global industry, with $4.1T in premiums collected worldwide in 2007. The U.S. had 2,723 property casualty insurance companies in 2007, with $1.3T in cash and invested assets. The cash and invested assets of the 1,190 life and health insurance companies was more than twice that amount, at $3T. Many of these companies are part of larger entities, as banking and insurance services have combined within the financial services sector.
The first mutual insurance company was formed in England in 1696, offering fire insurance. Many of the early property casualty firms were formed by farmers who could not obtain insurance from large companies. They created mutual insurance companies within their local areas and could offer reasonable rates. These were informal associations until legislation passed in the 1870s enabled their formation. After this, the industry flourished nationwide in England.
The life insurance industry was almost nonexistent before the advent of the mutual model. The first mutual insurance companies were created in 1843 in England, and the number grew to 19 by 1849. Mutual life insurance companies were the fastest growing model until 1859, when states began approving regulations that required all insurance companies to conform to better practices, and increased the viability of stockholder-owned firms.
Policyholders’ interest in a mutual insurance company comes from two sources. Policy holders are holders of an insurance policy that defines a set of rights, and they are also holders of a set of ownership interests. Their ownership interest arises from purchasing a policy and ends with termination of policy. This contrasts with many cooperatives, where ownership derives from purchase of a share of stock, and can continue during periods of non-use of the cooperative.
As with other cooperatives, ownership interests include governance and economic participation in the firm. Policy holders have the right to vote for the board of directors. State laws vary on voting rights and rights to vote on fundamental transactions (merger, dissolution, etc.). In most states, policy holders have rights to distribution of the assets on dissolution. In Minnesota and Wisconsin, these rights are limited, with some assets considered to be in the public interest. The board of directors has the right to decide on use of profit/surplus. The board may add to the surplus or distribute the surplus to members in the form of policy dividends (also called capital distributions). Policyholders can benefit from their economic participation in the firm in other ways, including premium reductions and premium credits.
Although the ownership model is similar, the evolution and benefits of mutual ownership for life insurance policyholders differs from that of property casualty customers. Life insurance customers have a contract with the company that may last several decades. They have a long-term interest in ensuring that decisions are not made at their expense. In stock-owned insurance companies, owners can potentially gain from changing the firm’s dividend and financing policies after insurance contracts are sold. When policyholders and owners are merged, in mutually owned firms, this conflict is eliminated.
Mutually owned property casualty insurance firms offer customers an opportunity to be rewarded for practices that lower their insurance claims. They are usually created in environments of market failure, by customers who cannot purchase insurance or are paying too much. Many successful firms focus on a particular industry, where risk management practices are shared. In a stockholder model, the benefits of better practices and lower claims would go to the owners. A mutually owned firm returns the benefits to the customers, through lower rates.
At the same time, there is a heightened opportunity for conflict between management and owners in mutual insurance companies, because many of monitoring devices used in stock-owned firms are unavailable (e.g., hostile takeovers, monitoring by stock analysts, and stock-based compensation programs).
Mutual ownership has historically been an important model for insurance firms, particularly in life insurance and property casualty. The insurance industry underwent significant structural changes in the past 20 years, particularly after the passage of legislation in the 1990s that removed some of the barriers between insurance companies and banks. Although the number of conversions from mutual to stock ownership increased steadily from 1960–1990, the pace of demutualization increased in the 1990s. A significant number of mutual companies wanted to diversify their activities beyond insurance, and needed greater access to capital. Some converted completely to stock ownership. Others formed mutual holding companies that are owned by the policyholders of a converted mutual insurance firm.. The holding companies own one or more stockholder-owned insurance firms, and have the opportunity to own banking subsidiaries. Because the insurance industry is regulated, structural changes were made within a regulatory framework that requires at least advance disclosure and often regulatory approval.
The list for mutual insurance comes from primary research. All economic data comes from survey work undertaken by the UWCC. The survey response rate for mutual insurance was 48%. We chose a sample of 265 firms with data from Guidestar [43], and all reporting cooperatives provided us with 2007 fiscal year-end data. Revenue and employment data for the top 15 mutual companies were supplemented from Onesource [44] and annual reports of the individual companies. The data collection and survey methodology is discussed in detail in the Data Collection [45] section in the Appendix.
Table 4-4 summarizes our data for the mutual insurance sector. There is >$840B in assets, $140B in sales revenue, and nearly $2B in wages and benefits pay. There are approximately 233 million memberships and 122,000 employees. Adding direct and indirect impacts to this activity, we see from Table 4-4.3 shows that mutual insurers account for >$227B in revenue, >500,000 jobs, $27B in wages paid, and >$48B in valued-added income.
| Economic Impact | Multiplier | Units | Direct | Indirect | Induced | Total | |
|---|---|---|---|---|---|---|---|
| Revenues | 1.209 | million $ | 187,343 | 17,273 | 21,956 | 226,571 | |
| Income | 1.756 | 27,427 | 8,750 | 11,982 | 48,159 | ||
| Wages | 1.846 | 14,419 | 5,426 | 6,772 | 26,616 | ||
| Employment | 1.829 | jobs | 321,414 | 105,729 | 160,642 | 587,784 | |
 [46]
[46]
 [47]
[47]
 [48]
[48]
 [49]
[49]
Some banks and other finance companies exist specifically to provide capital to cooperative businesses in the U.S. These include the National Consumer Cooperative Bank [50], an Association of Corporate Credit Unions [51], the Cooperative Finance Corporation [52], and the Federal Home Loan Bank System [53]. Arguably, we could also include the Farm Credit System [25] in this subsection (because one of its member companies lends specifically to agricultural cooperatives), but we have elected instead to keep it in a separate subsector because the Farm Credit System [25] also provides banking services directly to farmers. In this section, we briefly describe each of these organizations and systems, and report on their aggregate economic impact.
The National Cooperative Bank (NCB) [50] is a U.S. government-chartered corporation organized under the National Consumer Cooperative Bank Act in 1978 and privatized in 1981 as a financial services company. The bank, which is structured as a cooperative business with >2,500 member owners, also operates an affiliate nonprofit organization (NCB Capital Impact) that provides community lending and business development services, and a subsidiary federally chartered thrift (NCB [50], FSB) that provides banking services to NCB's [50] national customer base. NCB [50] lending initially focused on natural food and housing cooperatives, but has subsequently broadened to encompass a wide variety of sectors including healthcare, childcare, education, energy and manufacturing, and retail goods and services.
Corporate credit unions (CCUs) [12] were formed to meet the liquidity needs of credit unions, diminishing their reliance on banks and other vendors. Today there are 28 CCUs [12] that serve >8,000 natural person credit unions in the U.S. Each CCU has a specific geographic region and serves the credit unions within its jurisdiction by offering operational support, product service, and delivery. U.S. Central [11] was created in 1974 to be a centralized banker bank of the CCUs; its membership base includes CUSOs and CCUs.
The National Rural Utilties Cooperative Finance Corporation (CFC) [52] is a cooperative company owned by 898 electric utility systems, 511 telecommunications organizations, 66 statewide and regional service organizations, and 63 associates. CFC [52] provides financing, investment, and related services to its members. It raises funds for loan programs with the support of its owners' equity and investments and through the sale of multiple financing vehicles in the private financial markets.
The Federal Home Loan Bank System (FHLBS) [53] is composed of 12 cooperative banks, each with its own president and board of directors, and 8,100 member lenders who collectively own the banks. The system and its members are the largest source of residential mortgage and community development credit in the U.S. Members borrow money from the system using mortgages they issue as collateral, and the system secures loan funds by issuing debt in private capital markets. The FHLBS [53] is a Government Sponsored Entity with the implicit backing from the U.S. government, but no formal guarantee. The FHLBS [53] does not pay Federal income tax and borrows at low rates due in part to the implicit backing of the U.S. government. In return for this special treatment, the FHLBS [53] must pay 20% of its net earnings to help cover interest on debt issued by the Resolution Funding Corporation (which paid for the Savings and Loan Bailout), and contribute 10% of its earnings to affordable housing loans and grants (Ashcraft, 2008 [54]).
The list for cooperative financial institutions comes from primary research. All economic data comes from 2007 annual reports of the individual financial institutions. The data collection and survey methodology is discussed in detail in the Data Collection [45] section in the Appendix.
Table 4-4 summarizes our data for the Cooperative Finance subsector. There is >$1T in assets, $72B in sales revenue, and nearly $1B in wages and benefits pay. There are approximately 27,000 memberships and 6,000 employees. Adding direct and indirect impacts to this activity, Table 4-4.4 shows that cooperative finance lenders account for >$77B in revenue, 39,000 jobs, $2B in wages paid, and nearly $6B in valued-added income.
| Economic Impact | Multiplier | Units | Direct | Indirect | Induced | Total | |
|---|---|---|---|---|---|---|---|
| Revenues | 1.067 | millions $ | 72,691 | 2,130 | 2,707 | 77,527 | |
| Income | 1.756 | 3,381 | 1,079 | 1,477 | 5,937 | ||
| Wages | 2.987 | 757 | 669 | 835 | 2,261 | ||
| Employment1 | 6.254 | jobs | 6,251 | 13,035 | 19,805 | 39,091 | |
| 1Business to Business financing results in patronage refunds dwarfing wages resulting in a high employment multiplier. Basically we are saying this level of income should produce a very large employment effect. | |||||||
Links:
[1] http://reic.uwcc.wisc.edu/CU
[2] http://reic.uwcc.wisc.edu/farm
[3] http://reic.uwcc.wisc.edu/mutualinsurance
[4] http://reic.uwcc.wisc.edu/corpfin
[5] http://reic.uwcc.wisc.edu/sites/all/maps2/financial_services_coop_locations_new.jpg
[6] http://reic.uwcc.wisc.edu/ref#33
[7] http://reic.uwcc.wisc.edu/ref#52
[8] http://reic.uwcc.wisc.edu/ref#34
[9] http://reic.uwcc.wisc.edu/ref#22
[10] http://reic.uwcc.wisc.edu/ref#11
[11] http://www.uscentral.org/
[12] http://corporatenetwork.org/
[13] http://www.ncua.gov/
[14] http://www.ncua.gov/shareinsurance/
[15] http://www.americanshare.com/Public/Home.aspx
[16] http://www.cuna.org/
[17] http://corporatenetwork.org/default.asp?content=cn_whatisaccu
[18] http://www.nafcu.org/
[19] http://www.nascus.org/
[20] http://www.natfed.org/i4a/pages/index.cfm?pageid=1
[21] http://reic.uwcc.wisc.edu/sites/all//maps2/CU2.gif
[22] http://reic.uwcc.wisc.edu/sites/all//maps2/CU3.gif
[23] http://reic.uwcc.wisc.edu/sites/all//maps2/CU4.gif
[24] http://reic.uwcc.wisc.edu/sites/all//maps2/CU5.gif
[25] http://www.farmcredit.com/map/FCSystem.html
[26] http://reic.uwcc.wisc.edu/ref#55
[27] http://www.fca.gov/index.html
[28] http://reic.uwcc.wisc.edu/ref#28
[29] http://www.fcsic.gov/index.html
[30] http://www.farmcredit-ffcb.com/farmcredit/fcsystem/overview_fac.jsp;jsessionid=014011E0E5F53F227447156BF47F9536?uniq=1234454004889
[31] http://reic.uwcc.wisc.edu/ref#54
[32] http://www.fccouncil.com/
[33] http://www.agfirst.com/index.asp
[34] http://info.agribank.com/
[35] http://www.farmcreditbank.com/history2.htm
[36] http://www.usagbank.com/
[37] http://www.cobank.com/
[38] http://reports.fca.gov/CRS/FCSInstDescr.asp
[39] https://reports.fca.gov/CRS/FCSInstDescr.asp
[40] http://reic.uwcc.wisc.edu/financial
[41] http://reic.uwcc.wisc.edu/sites/all/farm_credit_branch_locations.jpg
[42] http://reic.uwcc.wisc.edu/sites/all/farm_credit_employment.jpg
[43] http://www.guidestar.org/
[44] http://www.onesource.com/
[45] http://reic.uwcc.wisc.edu/survey
[46] http://reic.uwcc.wisc.edu/sites/all/mutual_insurance_locations.jpg
[47] http://reic.uwcc.wisc.edu/sites/all/mutual_ins_branch_locations.jpg
[48] http://reic.uwcc.wisc.edu/sites/all/mutual_ins_branch_locations_employees.jpg
[49] http://reic.uwcc.wisc.edu/sites/all/mutual_ins_branch_locations_revenues.jpg
[50] http://www.ncb.coop/
[51] http://corporatenetwork.org/default.asp
[52] http://www.nrucfc.org/
[53] http://www.fhlbanks.com/
[54] http://reic.uwcc.wisc.edu/ref#4