Utilities cooperatives provide electric, telephone, and water services. Table 4-5 shows that the U.S. has 4,525 utility cooperatives; 1,970 provided us with data. These “reporting” cooperatives have nearly 20 million memberships that account for $119B in assets, $36B in revenue, 118,244 jobs and >$4B in wages. Cooperatives that provide electric utility services dominate this aggregate sector in terms of total economic activity, but many water cooperatives provide valued services to their communities.
We report only on firms for which we have collected economic data (some firms did not respond to our requests for information), so these numbers represent lower bounds regarding the full economic footprint of cooperatives in this aggregate sector. As described in the previous section, we extrapolated to the full population for the purpose of conducting our impact analysis. As a consequence, the sum of direct impacts in following subsections will be larger than the corresponding aggregate variables reported here.
| Economic Sector | Reporting | Total | Estab. | Assets | Revenue | Wages | Employees | Memberships | |||
|---|---|---|---|---|---|---|---|---|---|---|---|
| (firms) | (million dollars) | (thousands) | |||||||||
| Rural Electric1 | 889 | 920 | 2,052 | 111,786 | 34,275 | 3,757 | 67.37 | 16,652 | |||
| Generation and Transmission | 66 | 66 | 198 | 42,490 | 2,246 | 721 | 11.16 | 854 | |||
| Distribution2 | 823 | 854 | 1,854 | 69,296 | 32,029 | 3,036 | 55.21 | 15,798 | |||
| Rural Telephones | 158 | 255 | 255 | 5,116 | 1,520.84 | 521 | 12.61 | 964 | |||
| Water | 923 | 3,350 | 3,350 | 2,240 | 603 | 47 | 0.415 | 2,066 | |||
| Cooperatives and Mutuals | 567 | 2,228 | 2,228 | 1,401 | 350 | 24 | 0.395 | 1,753 | |||
| Associations | 355 | 1,122 | 1,122 | 839 | 253 | 23 | 0.21 | 312 | |||
| Total | 1,970 | 4,525 | 5,657 | 119,142 | 36,399 | 4,325 | 80.37 | 19,682 | |||
| Rural Electrics totals adjust for G&Ts | |||||||||||
| 1A residential meter defines an electric cooperative member (there may be multiple consumers at a single meter). | |||||||||||
| 2Distribution systems include rural electric cooperatives (RECs), public power districts (PPDs), and mutual electric distribution companies. | |||||||||||
 [1]
[1]
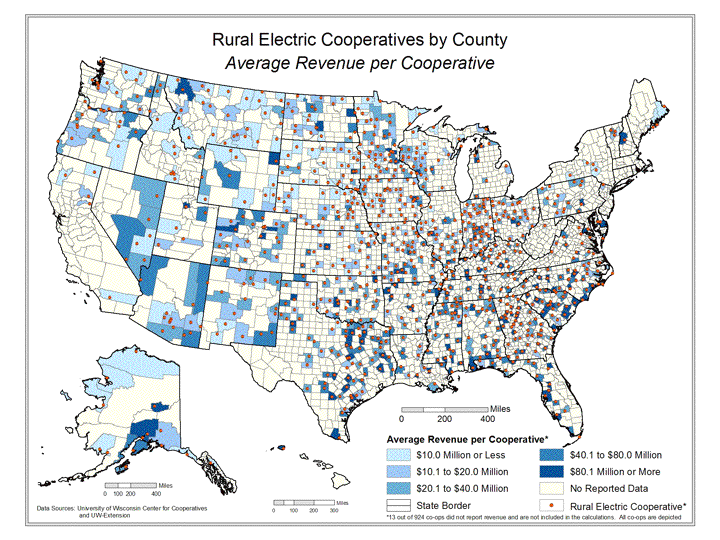
Rural electric cooperatives (RECs) are consumer-owned utilities that were established to provide reliable and affordable electricity by purchasing electric power at wholesale and delivering it directly to the consumer. These distribution cooperatives are primarily located in rural areas where the return on expensive infrastructure investment was not high enough to attract the investor-owned utilities (IOUs).
To assure an adequate supply of the cost-effective, reliable power that is vital to their survival, distribution cooperatives formed generation and transmission (G&T) cooperatives to pool their purchasing power for wholesale electricity. The G&T cooperatives provide wholesale power to their member-owners either by purchasing and delivering power from public- or investor-owned power plants, or by generating electricity themselves.
There are 864 distribution cooperatives delivering 10% of the nation's total kilowatt hours’ electricity to ultimate consumers each year. They serve 12% of the nation’s electric consumers (42 million people), but own and maintain 42% of the nation’s electric distribution lines that cover 75% of the country’s land mass (National Rural Electric Cooperative Association [NRECA(a)] [2]). Although electric cooperatives are not the dominant providers of electricity nationwide, they are the primary providers in most of the country’s rural areas.
Currently, 66 G&T cooperatives own 6% of the nation’s miles of transmission lines. Forty-five own generation facilities that account for approximately 5% of the total electricity generated in the U.S (NRECA(a) [2]).
In addition to providing electricity, many electric cooperatives are also involved in economic and community development activities.
It was only through cooperatives that electricity was provided to most of the nation’s farmers, their families, and rural businesses. By the 1930s nearly 90% of U.S. urban dwellers had electricity, but 90% of rural homes were without power. Investor-owned utilities often denied service to rural areas, citing high development costs and low profit margins. Consequently, even when they could purchase electricity, rural consumers paid far higher prices than urban consumers.
As part of Roosevelt’s New Deal, and in the face of significant opposition, the Rural Electrification Administration (REA) was created in 1935, and Congress passed the Rural Electrification Act a year later. In 1937, the REA drafted the Electric Cooperative Corporation Act, a model state law for formation and operation of rural electric cooperatives. The REA administered low-interest and long-term loan programs for rural electrification, and also provided technical, managerial, and educational assistance. By 1939, the REA had helped to establish 417 rural electric cooperatives, which served 288,000 households (New Deal Network, 2003 [3]).
The REA was replaced by the Rural Utilities Service (RUS) [4] in 1994, when Congress reorganized the USDA. RUS continues to work with rural electric cooperatives to build infrastructure and improve rural electric services.
Since the 1970s, electric cooperatives have been confronted with energy resource issues. The 1973 oil embargo and ensuing national energy policy initiatives prompted several G&Ts to participate in nuclear power plants. However, nuclear accidents and growing anti-nuclear movements brought cancellations of partially built plants. Some cooperatives filed for bankruptcy.
Electric utilities may perform generation, transmission, or distribution functions in the process of converting energy into electricity and delivering it to the consumer. Currently about 3,200 electric utilities throughout the U.S.; about 700 operate facilities that generate electric power. According to Energy Information Administration 2006 [5] data, generation accounts for 67% of the entire cost of providing electricity. Transmission and distribution account for 7% and 26%, respectively (Energy Information Administration, 2007 [6]).
Electricity is provided to residential, commercial, and industrial consumers by investor-owned utilities by IOUs, municipal utility districts (MUDs), public power districts (PPDs), and cooperatives. IOUs, as commercial, for-profit utilities owned by private investors, are capitalized by shareholder investment, retained earnings and borrowing on the open market. Profits earned by IOUs are returned to investors in proportion to the number of shares they own. While the U.S. has only 240 IOUs, they provide nearly 75% of the electricity sales to ultimate consumers. IOUs are usually subject to different regulations than are publicly-owned utilities and cooperatives, and they pay taxes as corporate citizens (Energy Information Administration, 2007 [6]).
MUDs are governmental entities created under state law to provide electricity, water, and waste water treatment systems to the residents of the municipality. State laws govern the creation of MUDs, and vary from state to state. MUDs are distinct from other utility providers because, as public entities, they can levy taxes, issue government bonds, and adopt and enforce rules and regulations. Directors of MUDs are appointed by the municipality. Although a few MUDs are members of NRECA [7], they are excluded from this analysis because they are government entities, operated by local governments.
Public utility districts (PUDs) are publicly owned entities created by state governments to provide power to residents in the district they serve. However, unlike MUDs, they are governed by a democratically elected board of PUD customers, have no taxing or other rule-making authority, and receive no income from taxes. PUDs can raise capital through revenue bonds sold on the private bond market. They operate on a nonprofit basis and define themselves as “customer-owned” utilities. All power supplied to Nebraska residents comes through PUDs. PUDs are included in this analysis.
Residential consumers use 37% of the nation's total electricity produced. Commercial and industrial consumers use 35% and 28% respectively. However, the customer base of cooperatives differs significantly from IOUs, and MUDs. Residential consumers, including farms, consume 57% of the electricity provided by cooperatives, but they comprise only 35% of the IOU customer base and 36% of the MUD base.
Cooperatives serve 7 customers per mile of line, as opposed to 35 for IOUs, and 47 for MUDs. They generate $10,565 in revenue per mile, while IOUs and MUDs produce $62,665 and $ 86,302, respectively. This disparity reflects the rural nature of the electric cooperatives’ primary service areas, where the geographically dispersed consumers generate the least revenue per mile.
Until the 1990s, all electricity providers operated as monopolies. A major deregulation effort during the 1990s, provided more competition in electricity markets, however. Although all IOUs are regulated by the Federal government, however. In all but 16 of the 47 states that have electric cooperatives regulators take the position that cooperatives are effectively self-regulated by locally elected boards of directors. While some states have excluded cooperatives from deregulation legislation, in states that have deregulated electric power supply, there has been little or no shift to other providers by rural electric cooperative members.
Most G&T cooperatives generate electric power from coal, like the industry in general. However, electric cooperatives actively support developing power from renewable resources. In 2007, electric cooperatives received 11% of their power from renewable sources, as compared to 9% for the nation’s entire electric utility sector (NRECA(b) [8]).
Electric cooperatives are incorporated under state statutes. They are considered nonprofit corporations and are granted Federal tax-exempt status under IRC section 501(c)(12), provided that 85% or more of their annual income comes from members.
Each rural electric cooperative (REC) customer is a member-owner, and membership is a requirement of all customers. Since most RECs operate as monopolies, consumers must become cooperative members if they wish to purchase electricity. Members are required to purchase all of the electric power for a specified location from the cooperative. However, in some cases RECs will sell power to non-members. Members elect a board of directors from among the membership on a one-member/one-vote basis.
As with other cooperatives, RECs strive to operate at cost. However, like other businesses, RECs must accumulate equity capital to support their operations and new initiatives. Because the members are owners of the cooperative, when the REC has net earnings (i.e., revenues exceed expenses), or margins, those margins are returned to member-owners based on patronage.
Among the REC cooperatives, the amount of margin allocated to each member is called a “capital credit.” Capital credits are allocated to members’ accounts, but the underlying value is retained by the cooperative for a period of time. Most RECs have capital credit retirement programs, by which the cooperative gradually returns the value of past allocated capital credits to members. In most cases, members receive the value of their capital credits as a deduction on their electric bill.
Since the Federal government’s early commitment to cooperative ownership during the New Deal, rural electric cooperatives have had strong government support through lending programs, and through power supply preference programs. REA loans and technical assistance provided the primary momentum for rural electric cooperative formation. Over time, however, the dominance of Federal lending has declined. Currently, RUS loans to electric cooperatives comprise <40% of total financing; >60% comes from private sector sources such as the CFC [9] and the National Cooperative Services Corporation (NCSC) [10]. Nonetheless, RUS [4] financing remains an essential component of the cooperative utility sector’s loan portfolio.
Further government lending supports rural electric cooperatives' economic and community development programs. USDA’s Rural Economic Development Loan and Grant (REDLG) program [11] provides zero-interest loans and grants through electric cooperatives to work in partnership with business and community leaders.
Electric cooperatives, as well as public utilities, have received preference from the Federal power marketing agencies since the first cooperative was established in 1937. The agencies market excess power generated by Federal water projects, and five power marketing agencies currently operate within the U.S. Department of Energy [12]. The government support provided through the “preference clause in power supply” has been critical to ensuring cooperative access to sources of power.
Although governmental support was critical to the formation of consumer-owned electric cooperatives, all electric utilities receive various federal subsidies. In fact, according to calculations based on Federal government financial reports, rural electric cooperatives receive the smallest Federal subsidy per consumer (NRECA(a) [13]) As with other utilities, government support to electric cooperatives has been provided through loan programs or policy involvement rather than direct subsidies.
The list for rural electric cooperatives and economic data comes from NRECA [7], 2006. The data collection and survey methodology is discussed in detail in the Data Collection [14] section in the Appendix.
Table 4-5 shows that we obtained data from 911 electric utilities, and collectively these firms account for >$97B in assets, exceed $34B in sales revenue, and pay close to $4B in wages. There are approximately 16 million memberships and 67,000 employees. As Table 4-5.1 shows, by extrapolating to the entire population (929 firms) and adding indirect and induced impacts to this activity, electric cooperatives account for >$45B in revenue, nearly 130,000 jobs, $6.6B in wages paid, and >$11B in valued-added income.
| Economic Impact | Multiplier | Unit | Direct | Indirect | Induced | Total | |
|---|---|---|---|---|---|---|---|
| Revenues | 1.265 | million $ | 34,275 | 4,039 | 5,033 | 43,347 | |
| Income | 1.757 | 6,318 | 2,035 | 2,747 | 11,100 | ||
| Wages | 1.749 | 3,757 | 1,262 | 1,552 | 6,571 | ||
| Employment | 1.907 | jobs | 67,625 | 24,524 | 36,825 | 128,974 | |
 [15]
[15]
 [16]
[16]
 [17]
[17]
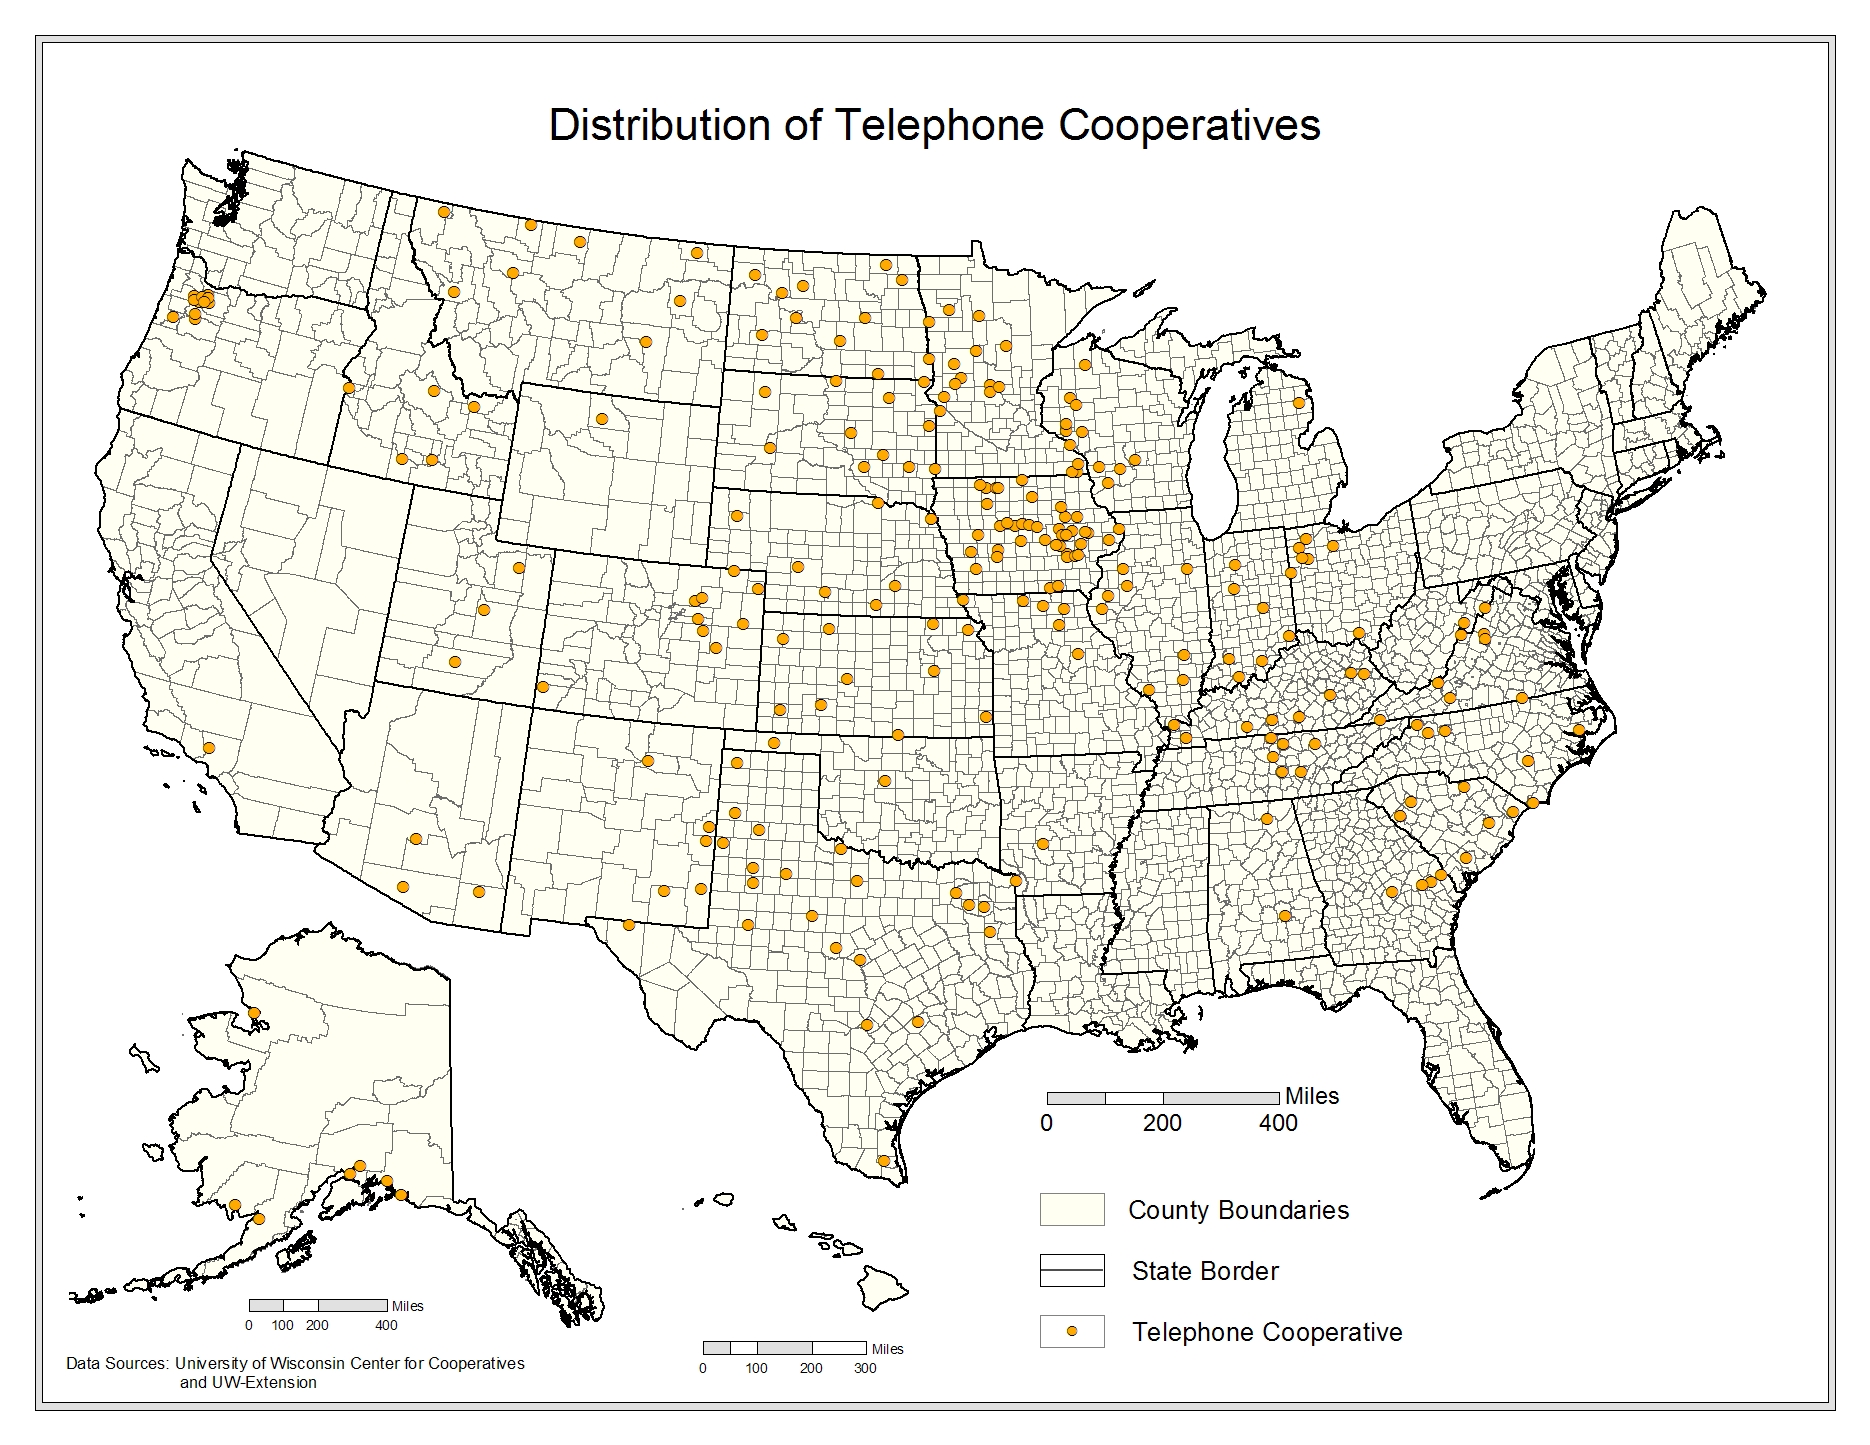
The 260 U.S. telephone cooperatives are consumer-owned utilities established to provide quality telecommunications service at reasonable cost. They offer various telecommunication services to 1.2 million rural Americans in 31 states. Telephone cooperatives are most often located in rural areas where there is a strong cooperative tradition. They provide local telephone exchange services, long distance telephone operations, direct broadcast satellite, wireless, TV, mobile radios, cellular and key systems, and Internet access.
While size varies significantly, the average telephone cooperative has >5,000 subscribers, 31 employees, and an annual revenue base between $1-5M. Like their rural electric counterparts, telephone cooperatives serve a very small proportion of the nation's telephone subscribers - about 5% - but their service area covers >40% of the country’s land mass (National Telecommunications Cooperative Association [NTCA](a)) [18].
The lack of telephone service in rural areas spurred the development of small telephone companies, and in areas where farmers were already familiar with agricultural cooperatives, the model was often used to provide telephone service to their communities. Although nearly 6,000 cooperatives, mutuals and other types of companies were providing telephone service to rural consumers by 1927 (NTCA)(b)) [19], poor business practices caused many to fail, leaving farmers and rural residents with significantly fewer telephones in 1940 than in 1920 (Hatfield, 1994) [20].
Major changes came to rural telephone companies with the advent of the New Deal. The 1934 Communications Act created the Federal Communications Commission (FCC) [21] to provide quality telephone service to all Americans at reasonable rates. However, rural telephone service availability and quality remained poor until long-term, low-interest loans for rural telephone companies became available as part of theREA [22] loan program in 1949. In 1961, the definition of telephone service was expanded to include provision of educational television, and in 1971, the Rural Telephone Bank (RTB) [23] was created to supplement direct loans from REA [22]. RTB was jointly owned by the Federal government and rural telephone companies, including cooperatives, until 2008, when the availability of other sources of capital made it obsolete.
Between 1934 and 1982, American Telephone and Telegraph (AT&T) [24] dominated the entire telecommunications sector. Independent local carriers, many of which were cooperatives, provided local wiring to end users and purchased access to long distance calling from AT&T. The 1982 breakup of AT&T created the seven regional carriers known as the “Baby Bells,” but demands to completely deregulate the industry continued until passage of the Telecommunications Act of 1996. This Act was the first major overhaul of the 1934 Communication Act, and set new standards with its competition and universal service provisions.
During the 1980s, advances in wireless and satellite technology brought about a tremendous increase in demand for telecommunications services. The National Rural Telecommunications Cooperative (NRTC) [25] was formed in 1986 to foster the development and growth of satellite technology in rural America. NRTC [25] is a joint venture of the NRECA [7] and the CFC [9], with support from the NTCA [26]. Members include both locally owned commercial telephone companies and cooperatives.
The telecommunications industry provides businesses, government, and retail consumers with a wide variety of communications products, including voice communications, internet access, data, graphics, television, and video. These products are provided through fixed wire lines and wireless systems. While wire line communication service continues to be dominant, new wireless communications technologies, internet services, and cable and satellite program distribution are fast gaining an equal share of the industry. The industry is characterized by substantial and fast-paced change in structure, technology, customer preferences, and government regulations, and is dominated by very large investor-owned firms.
The “telecom service value chain” combines production and sales of the “end device,” (e.g., a telephone) end-user connection to telecommunications services by wires and cables and a local carrier that maintains switching equipment that routes “content” to its final destination in the local area, or to another switching center that routes the content to its final destination. The local carrier also maintains the cable network that forms the backbone of the industry. Regional carriers are switching centers that provide content routing to and from the local carrier within a large (several-state) geographic region. The final step in the chain is long distance carriers that provide routing among the regional carriers and internationally.
While the Telecommunications Act of 1996 provided for entry of many competitors at all levels of the industry, the industry has also seen significant consolidation. AT&T [24] has expanded back through the chain to become a local and regional carrier, as has Sprint, the other giant in the industry.
Access to bandwidth has been a critical factor in the capacity of telecommunications firms to compete effectively, given the rising volume of high-bandwidth transmissions, such as internet data. To expand and upgrade bandwidth capabilities by extending higher capacity fiber optic cable to rural customers is very expensive, however, and many rural wired carriers are leveraging DSL technologies to compete.
To support the delivery of services to rural areas in this competitive environment, telephone cooperatives receive governmental support through RUS [4] loans, which are available for voice telephone service, broadband access, distance learning, and tele-medicine. RUS [4] also makes loans to telephone cooperatives to facilitate third-party lending for rural economic development job creation, and provides significant technical assistance.
Another important source of funding for innovation comes from mandatory contributions made by international and interstate communications carriers to the Universal Service Fund. The fund was established by the FCC [21] to assure that quality advanced telecommunications services are available to all consumers at equitable prices. Although determining what percentage of this amount went to telephone cooperatives is not possible, the websites of telephone cooperatives reflect the importance these cooperatives place on receipt of universal service funds.
Telephone cooperatives, and commercial telephone companies, are subject to regulation by the FCC [21], the Interstate Commerce Commission, state public utility commissions, and county and local regulators. In many states, however, cooperatives are not subject to state regulation because they are consumer-owned, and considered self-regulating organizations. In addition, like other RUS borrowers, telephone cooperatives are subject to regulations and guidelines established by RUS.
Telephone cooperatives are incorporated under state statutes specific to telephone cooperatives, or under the state’s general cooperative or corporate laws. Telephone cooperatives are considered nonprofit corporations and are granted Federal tax-exempt status under IRC section 501(c)(12), which requires that they be a cooperative, provide telecommunications services, and meet the 85% income from members rule.
Each telephone cooperative customer is a member-owner of the cooperative. Membership is required of all customers. Although telephone cooperatives were originally monopoly providers, many residents in their service areas can now choose among several telecommunications suppliers. Any person, firm, association, corporation, or political body within the cooperative service area can become a member. Members elect a board of directors from among the membership on a one-member/one vote basis. The number of directors on the board varies, depending on the size of the cooperative. Bylaws may provide that directors be selected from specified territorial districts and may further limit voting for any director to members located in the territorial district that a director represents. Directors are not compensated for their service.
Rural telephone cooperatives strive to operate at cost. However, like other businesses, telephone cooperatives must accumulate equity capital to support their operations and new initiatives. Net earnings allocated to each member based on patronage are called “capital credits”, and the underlying value is retained by the cooperative for a period of time. Most telephone cooperatives have capital credit retirement programs in which the value of past allocated capital credits is returned to members, most frequently as a credit on their telephone bill.
The list for rural telephone cooperatives comes from NTCA [26]. All economic data comes from survey work undertaken by the UWCC and Guidestar [27]. The survey response rate for rural telephone cooperatives was 39.5%, and all reporting cooperatives provided us with 2005 - 2007 fiscal year-end data. The data collection and survey methodology is discussed in detail in the Data Collection [14] section in the Appendix.
Table 4-5 shows that we acquired data on 158 telephone cooperatives, and collectively these firms account for >$5B in assets, exceed $1.5B in sales revenue, and pay >$521M in wages. There are approximately one million memberships and 12,000 employees. As Table 4-5.2 shows, by extrapolating to the entire population (255 firms) and adding indirect and induced impacts to this activity, telephone cooperatives account for close to $3.9B in revenue, 23,000 jobs, $1.3B in wages paid, and $1.8B in valued-added income.
| Economic Impact | Multiplier | Unit | Direct | Indirect | Induced | Total | |
|---|---|---|---|---|---|---|---|
| Industry Revenues | 1.608 | million $ | 2,412 | 653 | 814 | 3,879 | |
| Total Income | 1.757 | 1,022 | 329 | 444 | 1,795 | ||
| Labor Income | 1.530 | 858 | 204 | 251 | 1,313 | ||
| Employment | 1.785 | jobs | 12,634 | 3,965 | 5,954 | 22,553 | |
 [28]
[28]Close to 3,300 water cooperatives in the U.S. are consumer-owned utilities formed to provide safe, reliable and sustainable water service at a reasonable cost. They provide drinking, fire protection and landscaping irrigation water. In addition, many of them provide wastewater services. Water cooperatives are most often found in suburban and rural areas that are located too far from municipal water companies to receive service.
Most water cooperatives are small (serving 501 - 3,300 consumers) or very small (serving fewer than 500 consumers). Eighty-nine percent of the population that is served by public water systems is served by either a publicly owned, municipal water system or a cooperative utility. The remaining 11% of Americans are served by privately owned water systems. Nonprofit cooperatives are the most common organizational form in very small communities.
The association between disease and polluted water was recognized by the early 1900s and steps were taken to treat water before its distribution for human consumption. In contrast to the development of other utilities, early water systems were owned by private, for-profit entities. However, as cities and towns grew exponentially and the capital needed to develop water infrastructures increased, municipal governments assumed control of private utilities. After World War I, Congress exempted municipal bond interest from Federal taxation, enabling cities and towns to issue bonds at low-interest rates that were still attractive to investors. Much of the country’s water infrastructure has been supported by these tax-advantaged municipal bonds. Today most water systems are owned by municipalities.
As is true of other utilities, the expense of providing water to rural residents is considerably higher than providing it to urbanites, due to the large distances water must be transported. The number of rural water cooperatives and mutual associations increased significantly during the late 20th century old farm wells ran dry or became contaminated and unsafe.
Water cooperatives have long benefited from government support. In 1946, the Farmers Home Administration (FmHA) was given responsibility for implementing water programs. Since 1990, the programs have been administered through the RUS's [4] Water and Environmental Program (WEP) [29]. Many water cooperatives were developed with significant assistance from rural electric cooperatives, and local rural electrics have expanded into providing water services as well.
The EPA [30] describes a public water system as an organization that “provides drinking water to at least 25 people or 15 service connections.” Most of the U.S. population (292 million) receive their water from the nearly 155,000 public systems in the U.S. (EPA, 2008 [31]). This figure includes municipal systems, water cooperatives and mutual associations, water districts, and nonprofits. Most systems serve small populations spread over large geographic areas. In 2005, 85% of the systems were estimated to serve just 10% of the population (Water Science and Technology Board, 2002 [32]). An estimated 3,352 of these public water systems are cooperatives or mutual associations, nearly all of which are small- or medium-sized utilities. About 60% of the nearly $40B in revenue generated by U.S. water utilities is from household consumption (Grigg, 2007 [33]).
Water utilities have three major components: a water source, a treatment facility to remove pollutants and impurities and a distribution system. This delivery infrastructure, which spans nearly 1 million miles, is the primary asset of public water systems and represents a significant capital investment (National Research Council, 2006 [34]). In addition to providing enough water for both potable and non-potable needs, the water must be safe, of acceptable quality, provided at appropriate pressure with minimal loss, and economical.
The water sector currently faces many challenges. To replace a rapidly aging infrastructure, much of which was built in the late 1800s and the early 1900s, the American Water Works Association [35] estimated that $250B will be needed over the next 30 years (Water Science and Technology Board, 2002 [32]). Furthermore, consumers have become more educated about the industry, and are placing increasing demands on utilities for high-quality water provided in an environmentally sustainable way. Other challenges include meeting the increasingly stringent governmental standards for water quality, protecting the security of the water supply against potential terrorist threats, and replacing the large proportion of the experienced labor force approaching retirement age.
Significant investments in the water infrastructure are needed to meet these challenges, but represent costs that are particularly difficult for small- and medium-sized utilities to absorb. In 1998, the ratio of net utility plant cost per gallon of water supplied was about 3.5:1 for investor-owned water utilities, more than twice that of the energy and telecommunications utilities (Water Science and Technology Board, 2002 [32]). These costs are even higher for small and very small water systems, where the cost ratio is almost 8-10 times higher than for systems serving >50,000 customers. In response, some public water systems have turned to investor-owned firms, either to take ownership of the system and make needed capital investments, or to manage the system and provide needed technical expertise. Many are concerned about the loss of community control over the safety and distribution of water, and point to evidence from other countries that privatization may result in higher costs to consumers for lower quality water. Others think that private, profit-oriented capital investment is the only way to maintain the country’s water infrastructure.
The drinking water industry is regulated by a complex of local, regional, state, and national laws and organizations. Because water supply systems are monopolies, public utility commissions are responsible for regulating rates for private water companies, rates of return, and quality of service. However, publicly owned systems, cooperatives, and homeowners associations are exempt from price regulations. Because they operate on a nonprofit or not-for profit basis, and their directors are elected by consumers, it is presumed that the consumer or the public has control over rates (Water Science and Technology Board, 2002 [32]). Water quality is regulated by state agencies using Federal standards. In addition, drinking water systems that serve >3,300 people are federally required to periodically assess vulnerability to attacks by terrorists or others.
Water cooperatives are incorporated under state statutes specific to cooperatives, mutual associations, or nonprofit corporations. The term “water cooperative” is used here to indicate all of these organizational forms. Like other utility cooperatives, water cooperatives are considered nonprofit corporations and are granted Federal tax-exempt status under IRC section 501(c)(12), which requires that they operate on a nonprofit basis, provide water and/or wastewater services, and meet the 85% income from members rule. These cooperatives are found primarily in rural and suburban areas and provide water and wastewater services at cost.
Rural water cooperatives typically are organized by households and businesses that cannot connect to existing water systems, usually because they are located too far from an exiting system to make service financially feasible. In contrast, most mutual water associations were created to buy out the real-estate developers who built water systems to service their development properties (Young, 2002 [36]).
Each water system customer is a member-owner of the cooperative, and membership is required of all customers. Water cooperatives are democratically controlled enterprises either on a one-meter/one-vote or a one-member/one-vote basis. In nearly all cases, water cooperatives are monopoly providers, as are other water utilities. As a result, customers do not have the opportunity to choose among a variety of providers. Membership is typically open to any property owner within the designated water service area.
Water cooperatives are governed by a board of directors that establishes policies and provides oversight. Members elect the board of directors from among the membership. The number of directors on the board varies, depending on the size of the cooperative and the responsibilities of the board members. Since most water cooperatives are very small, there are usually no employees and the work is performed on a volunteer basis, often by the board members. The members typically elect 5 or more board members. While larger cooperatives hire staff to perform operational functions, board directors make most of the every-day decisions. Usually, directors are not compensated for their service.
Members usually vote only to elect board members. WEP [29] provides loans and grants to water systems in rural areas with fewer than 10,000 residents to develop and/or repair water and wastewater systems, reduce costs to a reasonable level for rural users, and provide technical assistance and training directly or through grants. Loans are made at variable rates depending on the need to meet applicable health or sanitary standards, and the median household income in the service area (Miller, 2004 [37]) Additional funds for specified uses are available to water systems through USDA Rural Development’s Community Facility Programs [38], and may also be available through state programs.
The list for water cooperatives comes from the EPA [30] and Guidestar [27]. All economic data comes from survey work undertaken by the UWCC and Guidestar [27]. The survey response rate was 35% for water cooperatives, 28.6% for water mutuals, 58.9% for water associations, and all reporting cooperatives provided us with 2005 - 2007 fiscal year-end data. We took a non-random sample of 445 water cooperatives with Guidestar [27] information. The data collection and survey methodology is discussed in detail in the Data Collection [14]section in the Appendix.
Table 4-5 shows the data we have from 923 water and waste cooperatives, and collectively these firms account for >$2.2B in assets, $1.7B in sales revenue, and pay $4.7M in wages. There are approximately 2 million memberships and 40,000 employees. As Table 4-5.3 shows, by extrapolating to the entire population (3,352 firms) and adding indirect and induced impacts to this activity, water and waste cooperatives account for close to $2.6B in revenue, 11,000 jobs, $408M in wages paid, and nearly $500M in valued-added income.
| Economic Impact | Multiplier | Unit | Direct | Indirect | Induced | Total | |
|---|---|---|---|---|---|---|---|
| Revenues | 1.190 | million $ | 2,170 | 184 | 228 | 2,582 | |
| Income | 1.780 | 279 | 93 | 125 | 497 | ||
| Wages | 1.457 | 280 | 57 | 71 | 408 | ||
| Employment | 1.328 | jobs | 8,542 | 1,123 | 1,681 | 11,346 | |
 [39]
[39]
Links:
[1] http://reic.uwcc.wisc.edu/sites/all/maps2/combined_coop_locations_electric_water_telephone.jpg
[2] http://reic.uwcc.wisc.edu/ref#35
[3] http://reic.uwcc.wisc.edu/ref#40
[4] http://www.usda.gov/rus/
[5] http://reic.uwcc.wisc.edu/ref%2523refs
[6] http://reic.uwcc.wisc.edu/ref#12
[7] http://www.nreca.org/
[8] http://reic.uwcc.wisc.edu/ref#34
[9] http://www.nrucfc.org/
[10] http://www.ncsc.coop/
[11] http://www.rurdev.usda.gov/ga/tredleg.htm
[12] http://www.energy.gov/
[13] http://reic.uwcc.wisc.edu/ref#33
[14] http://reic.uwcc.wisc.edu/survey
[15] http://reic.uwcc.wisc.edu/sites/all/RE2.gif
[16] http://reic.uwcc.wisc.edu/sites/all/RE3.gif
[17] http://reic.uwcc.wisc.edu/sites/all/RE4.gif
[18] http://reic.uwcc.wisc.edu/ref#38
[19] http://reic.uwcc.wisc.edu/ref#39
[20] http://reic.uwcc.wisc.edu/ref#29
[21] http://www.fcc.gov/
[22] http://newdeal.feri.org/tva/tva10.htm
[23] http://www.usda.gov/rus/telecom/rtb/index_rtb.htm
[24] http://www.wireless.att.com/cell-phone-service/welcome/index.jsp?WT.srch=1
[25] http://www.nrtc.coop/us/main/index
[26] http://www.ntca.org/
[27] http://www.guidestar.org/
[28] http://reic.uwcc.wisc.edu/sites/all/telephone_coop_locations.jpg
[29] http://www.usda.gov/rus/water/
[30] http://www.epa.gov/
[31] http://reic.uwcc.wisc.edu/ref#60
[32] http://reic.uwcc.wisc.edu/ref#61
[33] http://reic.uwcc.wisc.edu/ref#27
[34] http://reic.uwcc.wisc.edu/ref#32
[35] http://www.awwa.org/
[36] http://reic.uwcc.wisc.edu/ref#64
[37] http://reic.uwcc.wisc.edu/ref#31
[38] http://www.rurdev.usda.gov/rhs/cf/cp.htm
[39] http://reic.uwcc.wisc.edu/sites/all/water_coop_locations.jpg