Social and public service cooperatives are composed of firms that provide a diverse array of healthcare [1], housing [2], transportation [3], and education [4] services. Table 4-3 shows that only 841 of the 11,311 social and public service cooperatives in the U.S provided us with data. These "reporting" cooperatives have 1 million members that account for $1.7B in assets, $4.3B in revenue, nearly 100,000 jobs and >$600M in wages. Housing cooperatives dominate this aggregate economic sector in terms of the number of entities, but healthcare dominates in terms of economic activity. There are >300 cooperative healthcare providers, of which 100 collectively account for >$1B in assets and $3.2B in revenues. The healthcare subsector also accounts for the largest share of employees and members within this aggregate sector.
We report only on firms for which we have collected economic data (some firms did not respond to our requests for information), so that the data represents lower bounds regarding the full economic footprint of cooperatives in this aggregate sector. As described in the previous section, we extrapolated to the full population to conduct our impact analysis. Therefore, the sum of direct impacts in the following subsections will be larger than the corresponding aggregate variables reported here.
| Economic Sector | Reporting | Total | Estab. | Assets | Revenue | Wages | Employees | Memberships | |||
|---|---|---|---|---|---|---|---|---|---|---|---|
| (firms) | (million dollars) | (thousands) | |||||||||
| Healthcare | 192 | 305 | 305 | 1,109 | 3,290 | 283 | 73.18 | 961.22 | |||
| Childcare | 563 | 1,096 | 1,096 | 45 | 86 | 0.81 | 8.17 | - | |||
| Housing1 | - | 9,471 | 9,471 | - | - | - | - | - | |||
| Transportation | 13 | 49 | 49 | 68 | 290 | 8.60 | 0.50 | 29.08 | |||
| Education | 121 | 390 | 390 | 428 | 692 | 313 | 9.75 | 14.80 | |||
| Total | 841 | 11,311 | 11,311 | 1,650 | 4,358 | 605 | 91.60 | 1,005 | |||
| 1 Economic data is not available for the housing sector. | |||||||||||
 [5]
[5]
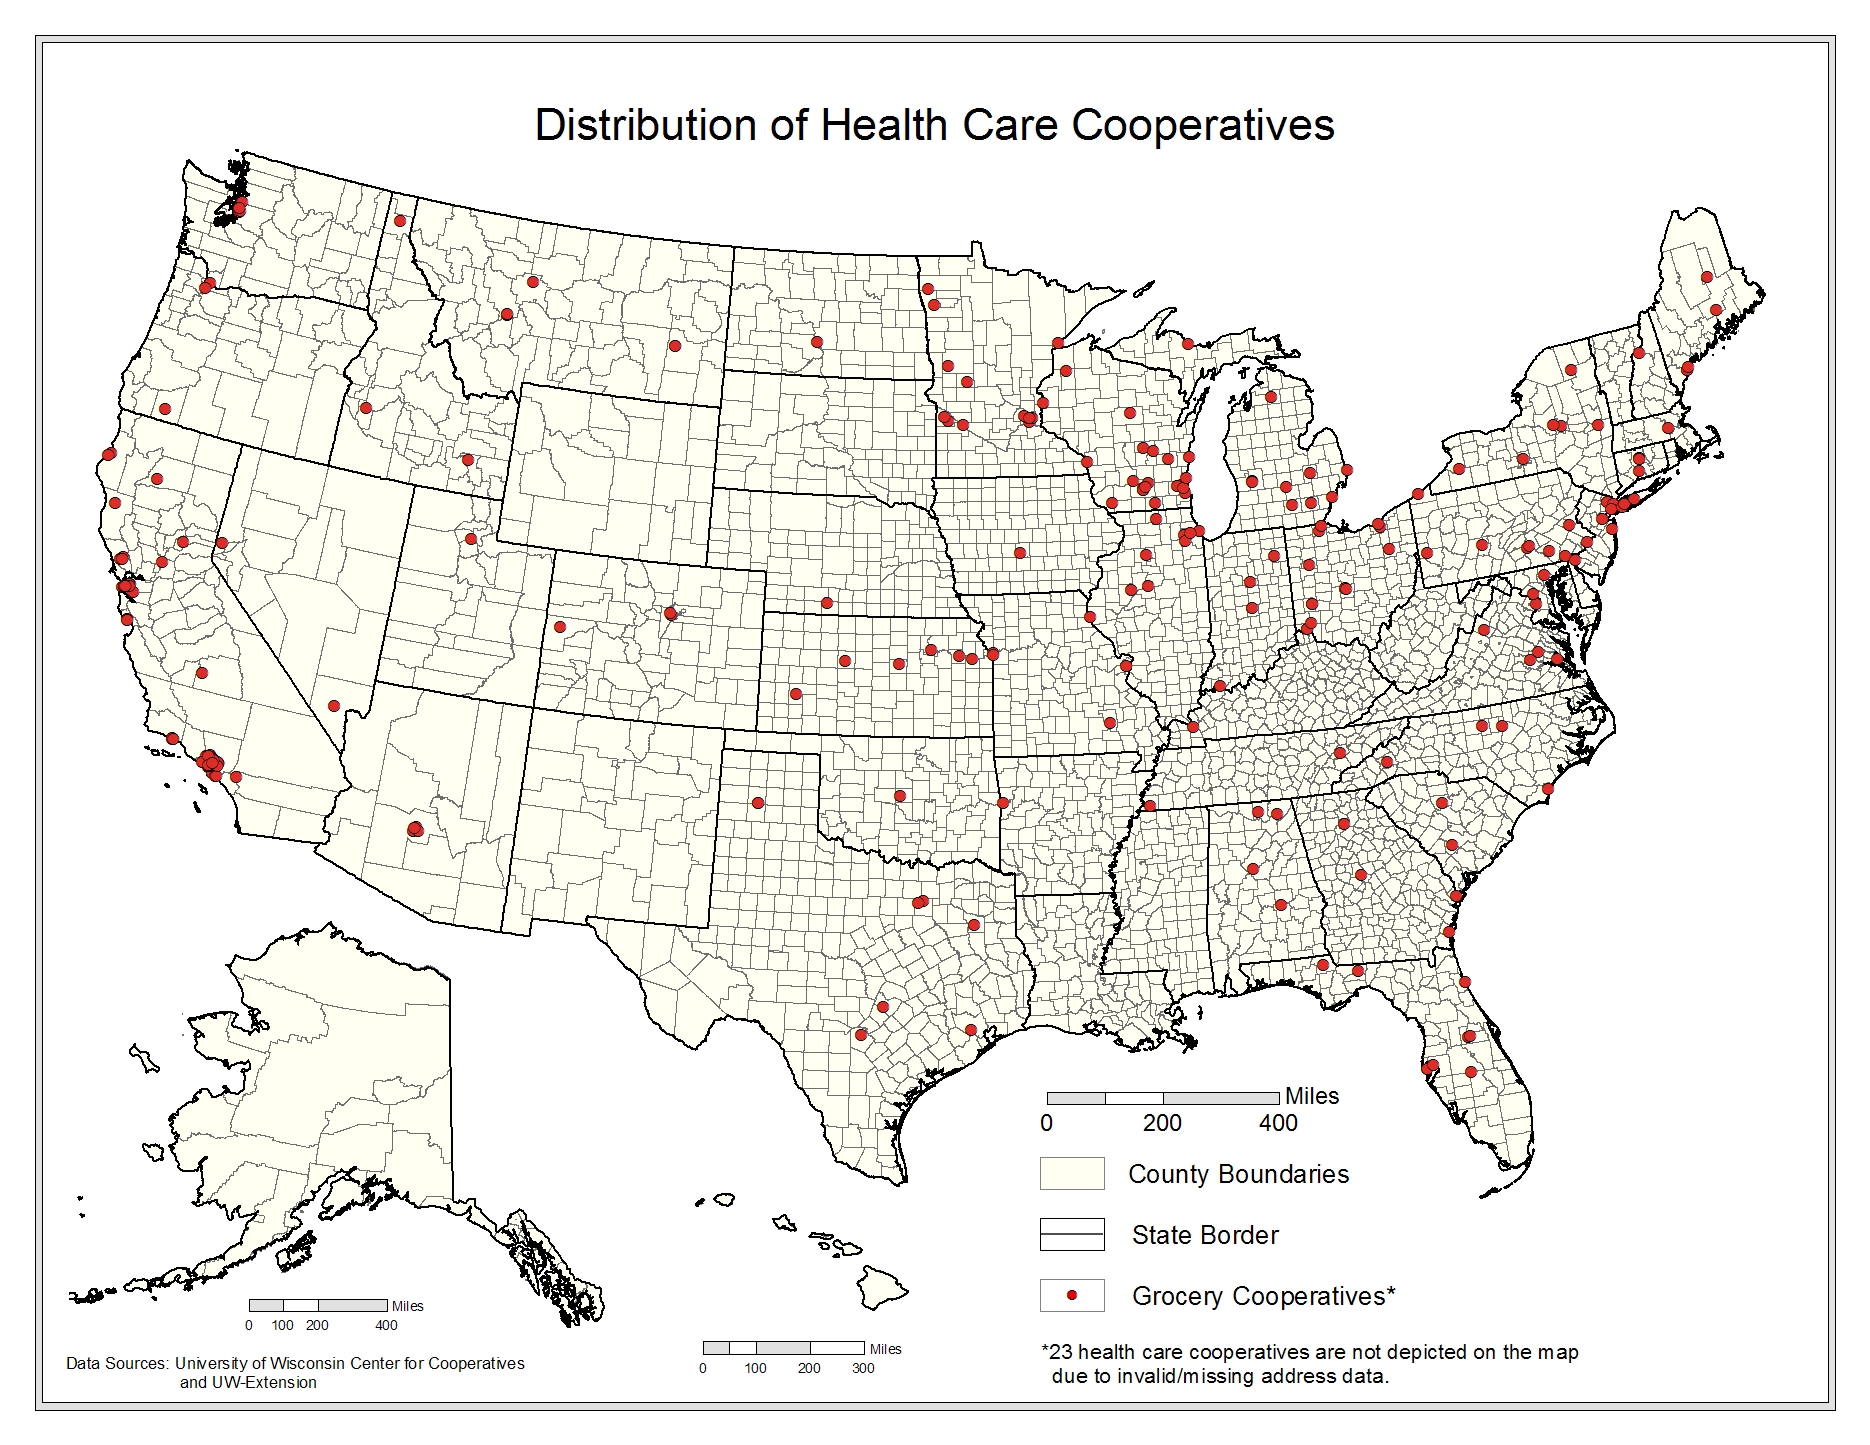
Cooperatives have been part of the U.S. healthcare system since the early 1900s, when hospitals formed the earliest purchasing groups. Although joint purchasing by hospitals is still the most active subsector within healthcare, organizations and individuals cooperate to achieve a wide range of health-related goals. Hospitals and clinics save money by engaging in joint purchasing or service delivery; employer groups jointly negotiate better choices in health insurance rates for their employees; cooperatives/collectives offer controlled access to medical marijuana; worker-owned homecare cooperatives strive to improve service to clients through better working conditions for their workers; and provider networks cooperate to improve rural health care. The organizations may be organized as nonprofits or cooperatives, serving local, regional and/or national markets.
The first group purchasing organization in health care was formed in 1910 to purchase laundry services in New York. Currently, >600 group purchasing organizations exist, and most hospitals belong to at least one organization. These organizations negotiate with vendors for a wide range of hospital supplies and services.
In the 1970s and 1980s, rural areas in the U.S. were losing their doctors, hospitals and clinics. Rural health care providers responded by forming health networks. Some early networks were organized as cooperatives, but most are nonprofits with boards that include a large percentage of network members. Networks may offer their members administrative services (such as legal advice, coding assistance, financial consulting, and computer/networking expertise), human resource-related services (such as worker recruitment and professional development), specialized medical services (such as speech or audiology), quality assurance expertise, and joint purchasing.
In the 1970s, in response to rising health insurance costs, employers began to form groups to purchase health insurance. Many purchasing groups were cooperatives. More than 25 states have statutes that promote state- or employer-sponsored purchasing cooperatives. Much of the legislation was in place by the early 1990s, although some legislative activity continues. Many policy makers and communities hoped that the cooperatives would achieve significant cost savings, but analysts recognized the difficulty of avoiding adverse selection without some type of mandated use. Although legislation that would have mandated state or employer-sponsored purchasing cooperatives was discussed during the Clinton health care reform debates, it never passed. Furthermore, while the employer groups are consistently referred to as cooperatives, their business structure varies. For example, in California, an early purchasing cooperative, Health Insurance Plan of California, was originally operated by a state agency. It was later transferred to a nonprofit organization, the Pacific Business Group on Health [6]. In Texas, legislation was passed in 1993, 2003, and 2005 that authorized groups of employers to form cooperatives to purchase health insurance. The cooperatives are required to form as nonprofits and then register as purchasing cooperatives with the Texas Department of Insurance [7].
After the passage of Proposition 215 in 1996, which legalized medical marijuana in California, dozens of cooperatives, collectives, and buying clubs were established to distribute the drug. Guidelines for the cooperatives/collectives were articulated in California SB420, which passed in 2004 and allowed consumers to grow small quantities of marijuana collectively. To operate legally in California, they must follow guidelines that include operating as nonprofit cooperatives or collectives, paying sales taxes, and allow purchase only by patients or care-givers.
Worker-owned home care cooperatives are emerging as a way to both address high staff turnover and to improve the quality of home care services provided to the elderly and disabled. The first worker-owned home care cooperative, Cooperative Home Care Associates (CCHA), was formed in New York City in 1985, as an alternative to nonprofit and private agencies. CCHA’s goal was to reduce turnover and provide quality home care to clients by improving the workplace and compensation for home care paraprofessionals. Since 1985, a small number of additional worker-owned homecare cooperatives have been formed.
The smallest subsector is consumer-owned health maintenance organizations (HMOs). Few HMOs are genuine cooperatives. Most states require HMOs to incorporate under nonprofit or mutual insurance laws. Wisconsin is one of the few states to allow HMOs to incorporate as cooperatives, but to also have nonprofit and charitable status.
Health care in the U.S. is provided by a combination of nonprofits, commercial enterprises, and the government. Most health care is paid for through insurance plans, which are funded by employers, privately purchased, or provided by the government. The marketplace for health providers and insurers is local, regional, and national, with significant competition in many communities, especially metropolitan areas.
The only subsector with significant market share is the group purchasing organizations (GPOs). Nine organizations represent 80% of volume purchased through GPOs. These organizations include cooperatives, nonprofit organizations, and for-profit companies. Remarkably, 72% of all hospital purchases are through GPOs, and almost all hospitals use at least one GPO contract, with the average hospital using two to four. Although hospitals formed the first GPOs, clinics and long-term care facilities represent a growing membership.
Employer health care coalitions are another influential subsector, although they have not achieved significant cost savings for their members. There are >90 employee health care coalitions. According to a 2002 study, they have successfully allowed members to provide health care coverage choices to their employees, but their market share is small and they have not achieved significant cost savings (Wicks, 2002 [8]).
Cooperative health care organizations are organized as cooperatives, nonprofits, and corporations. Regardless of legal structure, they operate for the benefit of their members. Some are organized under statutes that specifically authorize cooperatives to perform a function, such as purchasing health care for small employers, or controlling access to medical marijuana. These statutes vary considerably from state to state, and might not define governance or ownership rights and roles.
For purposes of this analysis we include health care organizations that are organized to benefit a clearly defined group (employers, health care providers, workers, etc.) and are governed by boards that have significant representation from the membership. Although community health centers do exhibit some of these characteristics, they are not included in the sample.
The list for health care cooperatives come from purchasing healthcare cooperatives maintained by National Cooperative Business Association [9], worker healthcare cooperative lists maintained by Melissa Hoover, USFWC [10] with Prof. Christina Clamp [11], and primary research. All economic data comes from survey work undertaken by the UWCC. The survey response rate was 58% for healthcare cooperatives, 48% for purchasing healthcare cooperatives, and 32% for worker healthcare cooperatives, and all reporting cooperatives provided 2007 fiscal year-end data. Revenue and employment data for purchasing cooperatives was supplemented from Onesource [12]. The data collection and survey methodology is discussed in detail in the Data Collection [13]section in the Appendix
Table 4-3 shows that we have data from 192 health-care cooperatives and collectively these firms account for >$1B in assets, >$3B in sales revenue, and pay $283M in wages. There are approximately 961,000 memberships and 73,000 employees. As shown in Table 4-3.1, by extrapolating to the entire population (305 firms) and adding indirect and induced impacts to this activity, health-care cooperatives account for >$5B in revenue, close to 500,000 jobs, $1B in wages paid, and >$1B in valued-added income.
| Economic Impact | Multiplier | Units | Direct | Indirect | Induced | Total | |
|---|---|---|---|---|---|---|---|
| Revenues | 1.011 | million $ | 5,157 | 25 | 30 | 5,211 | |
| Total Income | 1.717 | 727 | 222 | 299 | 1,248 | ||
| Wages | 1.816 | 561 | 206 | 252 | 1,019 | ||
| Employment | 1.535 | jobs | 262,844 | 56,577 | 84,165 | 403,586 | |
 [14]
[14]
The demand for quality child care has grown significantly, as increasing numbers of women have joined the workforce over the past 25 years. By 2007, >57% of women in families with children under age 6 were employed (U.S. Department of Labor, 2008 [15]). Considerations of quality, availability and cost all drive a family’s child care decisions, and many families use multiple providers to meet their needs.
Demand for childcare may also exist independent of the need to support a family’s work schedule. The growing recognition of the benefits of early childhood education, which can foster social, emotional, intellectual and physical development, also drives the demand for quality child care programs.
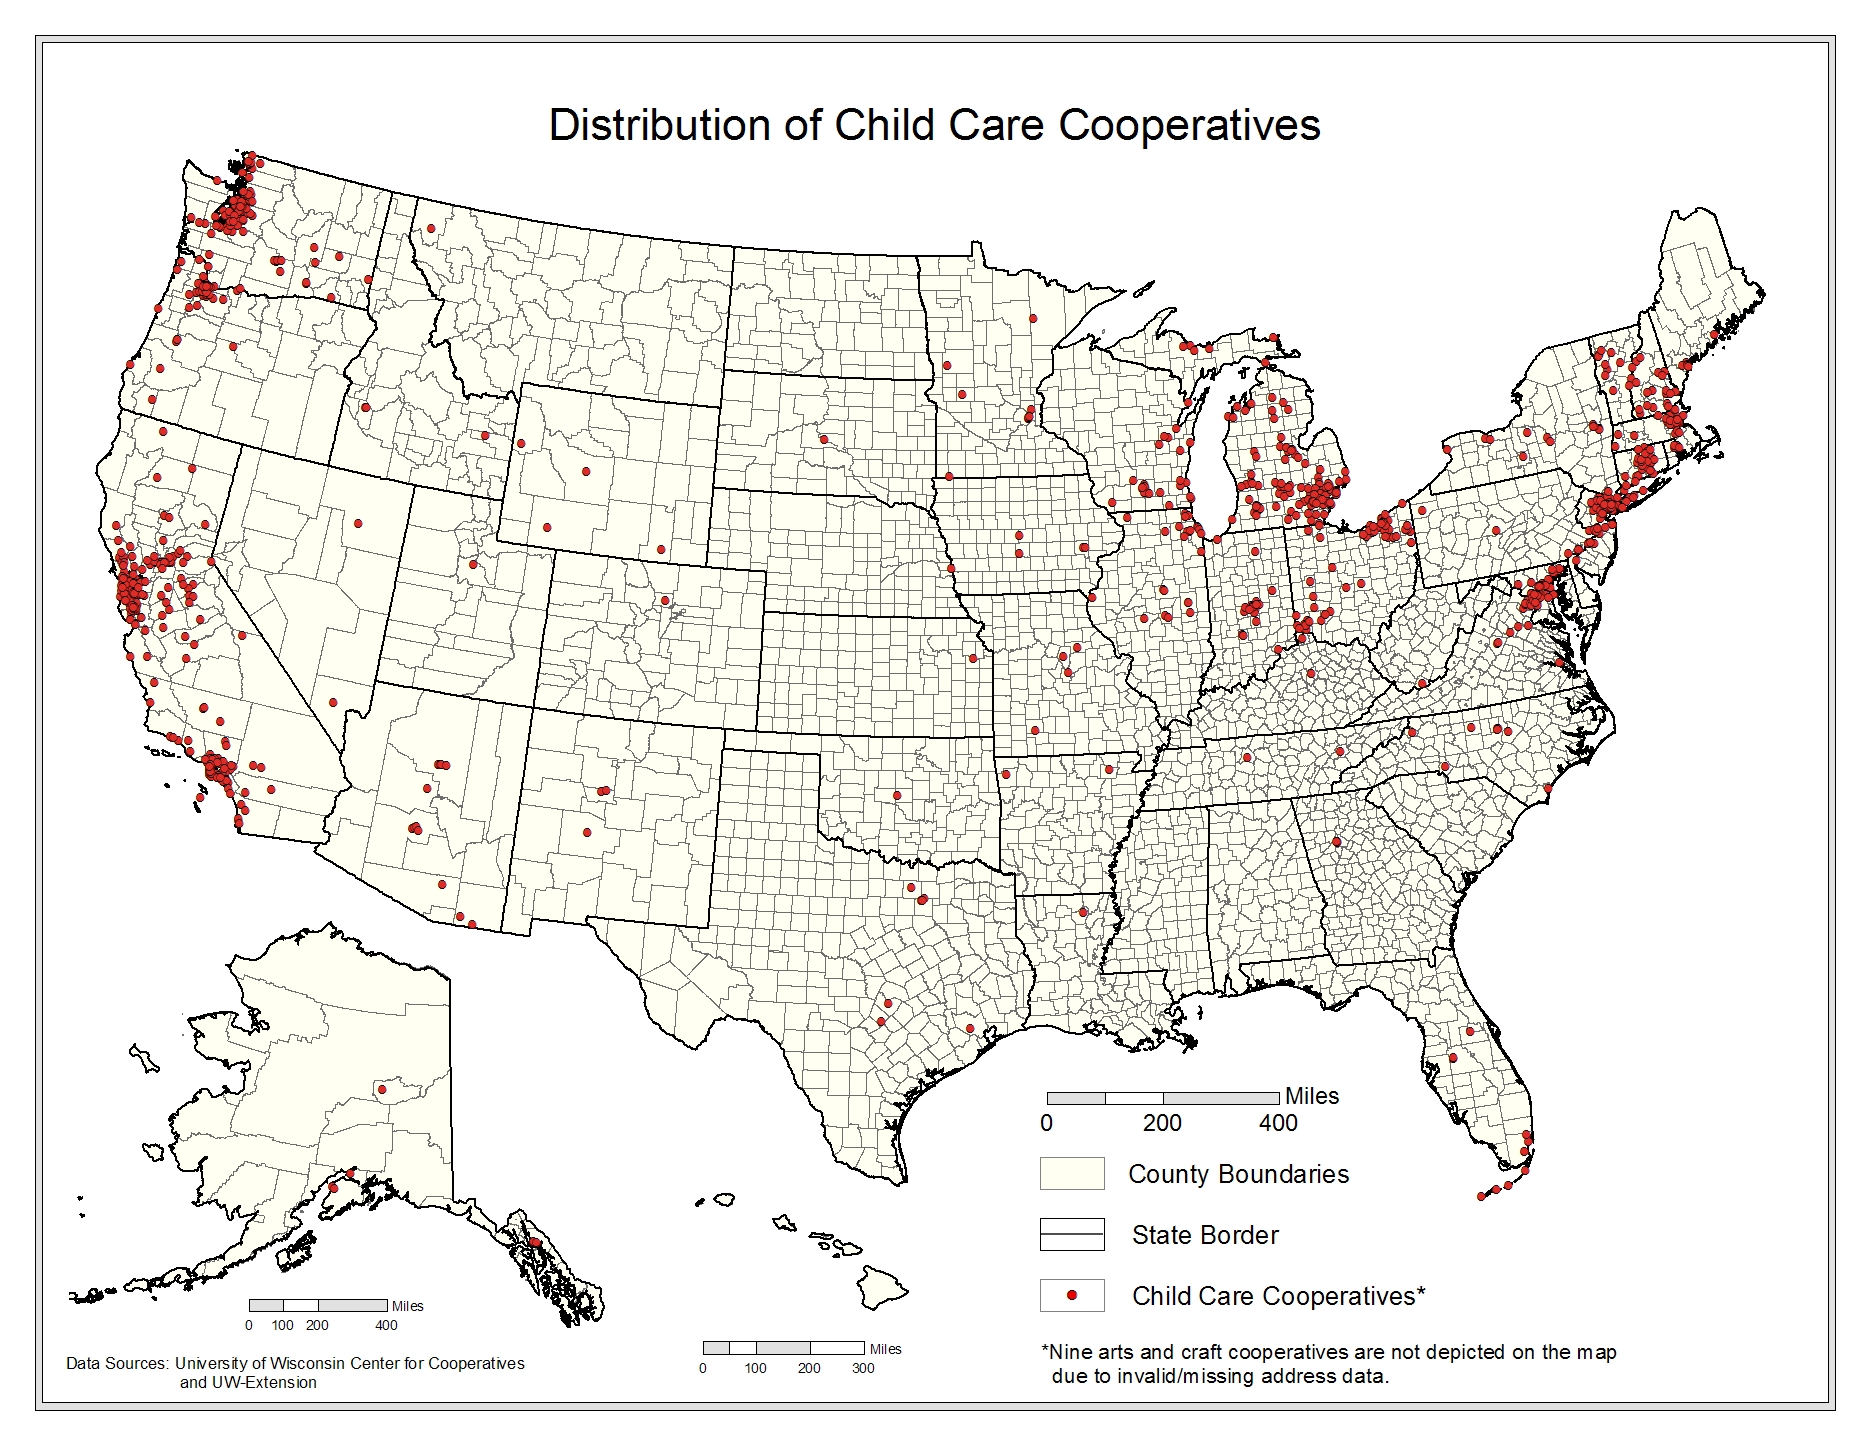
Child care cooperatives are one alternative in the child care mix. Organized around structured activities and supervised play for toddlers through preschool-aged children, the cooperative typically depends on parent assistance in the classroom. Parental participation in the classroom experience can be a strong incentive for cooperative membership, since it provides parents a chance to more directly observe and contribute to the quality of their child’s care and early learning experiences outside the home. It is also viewed as a learning opportunity for parents, either informally or through more structured training that may be available to parent members.
Membership in the cooperative is open to parents or guardians of children who attend the cooperative. Some level of volunteer activity to support the cooperative’s operations is also expected of the parents, which reduces the cost of the programs. Some child care cooperatives offer full-time child care services, but others are organized to provide part-time programs. While organized groups of families trading childcare hours are also called childcare cooperatives, they are not included in this survey because of their more informal, impermanent, barter-type arrangements.
Most families with preschool children and working mothers use child care services. Almost 25% of these families use an organized child care facility as the primary care arrangement; a greater percentage of families likely use child care centers to supplement other primary care arrangements, such as a family daycare provider (U.S. Congress, 2004 [16]). Approximately 80,000 center-based early education and child care programs were providing services in the U.S., according to the most recent comprehensive study that included licensed centers, early education programs, center-based programs exempt from state or local licensing (such as programs sponsored by religious organizations or schools), and licensed family day care. A more narrowly focused study a few years later reported >113,000 regulated child care centers (U.S. Congress, 2004 [16]).
Child care cooperatives are a subset of these center-based early education and child care programs. Many are overtly founded on the principle that the best educational experiences for young children results from a partnership between parents and teachers, and work to maintain a high adult-to-child ratio. All recognize the contributions of parent volunteer activities to maintain the child care organization.
While parents value quality child care, they often face difficulties in evaluating the care a program provides. Child care cooperatives offer a greater degree of transparency for parents and caregivers, given a cooperative structure based on parental involvement.
Childcare cooperatives are typically incorporated as nonprofit organizations, since they provide educational services. As educational entities, they are eligible for a 501(c)(3) Federal tax-exempt designation, which also allows them to apply for public and private grants, and to accept tax-deductible donations.
Child care cooperatives differ from other nonprofit educational organizations by the control exercised by the parents who use the cooperative’s child care services. Parents democratically elect representatives to a board of directors that operates the cooperative. Frequently staff and teachers also may be represented on the board, but do not typically have voting rights. Depending on the size of the school, there may be a director who provides continuity in the overall management of the cooperative’s business.
In addition to tuition or fees for the child care services, volunteer involvement by parents in the affairs of the cooperative is highly encouraged, if not required. Some cooperatives require a commitment to a certain number of hours of volunteer time, or participation on a committee. Parental participation in the classroom supports the ability of the cooperative to provide a high adult-to-child ratio, and volunteer labor for housekeeping and administrative duties aids in reducing operating costs. Frequently, parents are also expected to engage in some type of fundraising activity for the cooperative.
Child care cooperatives are examples of 501(c)(3) nonprofit organizations that operate as cooperatives in terms of patron control, but are prohibited from making distributions to members. As with many nonprofit cooperatives, the child care services may be considered the benefits that accrue based on patronage. The degree of actual degree member control varies widely among these cooperatives. In some cases, parents may be required to volunteer in the classroom or perform other tasks to support the operation of the cooperative, but they are not expected to take an active role in the control and governance of the organization.
The data on childcare cooperatives comes from primary research conducted by the UWCC. All economic data comes from survey work undertaken by the UWCC and Guidestar [17]. The survey response rate for childcare cooperatives is 43% and all reporting cooperatives provided us with 2005-2006 fiscal year-end data. The data collection and survey methodology is discussed in detail in the Data Collection [13] section in the Appendix.
As Table 4.3 shows, we have data for 563 child-care cooperatives and collectively these firms account for >$45M in assets, nearly $86M in sales revenue, and pay nearly $1M in wages. There are approximately 8,000 employees; we did not collect membership information for childcare cooperatives. As Table 4-3.2 shows, by extrapolating to the entire population (1,096 firms) and adding indirect and induced impacts to this activity, child-care cooperatives account for >$420M in revenue, nearly 6,000 jobs, $141M in wages paid, and >$200M in valued-added income.
| Economic Impact | Multiplier | Units | Direct | Indirect | Induced | Total | |
|---|---|---|---|---|---|---|---|
| Revenues | 2.615 | million $ | 161 | 105 | 155 | 421 | |
| Total Income | 2.356 | 101 | 52 | 85 | 238 | ||
| Wages | 2.238 | 63 | 30 | 48 | 141 | ||
| Employment | 1.435 | Jobs | 4,128 | 661 | 1,136 | 5,925 | |
 [18]
[18]
A housing cooperative is a corporation that exists to provide housing to its owners, who are the people who live in the cooperative. These people own a share of stock in the cooperative corporation, which owns the land and buildings. The stock gives the owners an exclusive right to occupy a particular dwelling unit and participate in governance of the cooperative.
Housing cooperatives and condominiums are both examples of shared interest housing, providing opportunities for people to own units within multi-family buildings. Both models were developed in Europe as an alternative to the rental model. The first cooperative in the U.S. was built in New York City in 1876, 75 years before the first condominiums. Most of the early cooperatives were in luxury buildings, but there were also several affordable housing cooperatives built by labor unions during the period before World War II.
The history of housing is linked closely to Federal, state, and local policies. Although the earliest cooperatives were designed for people with high incomes, a cooperative housing model was developed that encouraged long-term affordability by restricting the appreciation of share value when membership shares are sold. Known as “limited equity cooperatives”, these cooperatives were usually built with some private or public subsidy and required a low initial membership fee. The first significant government program supporting housing cooperative development was the New York Limited Dividend Housing Companies Act of 1927. Thirteen cooperatives were built under this Act. A subsequent New York law, known as the Mitchell-Lama Act, was passed in 1955 and supported the development of 60,000 affordable units, mostly in the 1960s and 1970s. Labor unions and housing activists built 40,000 more units, for a total of 100,000 affordable housing cooperative units in New York state. On a federal level, cooperatives were largely left out of the immediate post-WW II support for affordable housing, but they were included in several important subsidized mortgage programs passed by Congress in the 1960s. By 1995, an estimated 137,000 cooperatively owned affordable units had been built with Federal support in 29 states.
During this period, cooperatives continued to be built for the higher income market, and cooperative owners benefited from Federal tax policies that encouraged home ownership. By 1960, 1% of all multi-family dwellings were cooperatively owned. In 1976, this figure was 2.2%, but by this time every state had a condominium statute and condominiums had replaced cooperatives as the preferred owner-occupied model (Sazama, 2000 [19]).
Owner-occupied multi-family dwellings have become increasingly popular in the U.S., with a 227% increase from 1977-2007. Most of that new development has been in condominiums, which currently represent 5% of the nations’ total housing. Cooperatives are <1% (U.S. Bureau of the Census, 2005 [20]).
Although condominiums have dominated the shared interest housing market, cooperative ownership has expanded in several regions and markets. In Minnesota, 74 senior housing cooperatives with 5,600 units have been built since the 1970s, with most of them <10 years old. Their financial structure has been designed to limit asset appreciation and to free up cash assets for the owners by requiring a share price that is <100% of the cost of the unit. As the cooperatives market to seniors, they emphasize strong social networks and self-reliance to a group of people who are concerned about displacement and the loss of control that can accompany aging (Senior Cooperative [21]). Cooperatives for seniors are important also in California, Michigan, and Florida. In Florida, naturally occurring retirement communities are often manufactured home parks. Florida has 88 parks with 5,000 units (Florida Department [22]). In New Hampshire, where the New Hampshire Community Loan Fund [23] has provided loans for conversions from investor-owned to resident-owned parks, 158 parks are resident-owned, providing 41,278 units (New Hampshire, 2007 [24]). Conversions have also been significant in Washington, DC, where 2,270 units of affordable rental housing have converted to limited equity cooperatives (Coalition for Nonprofit Housing, 2004 [25]).
The legal structures of condominiums and cooperatives differ significantly. Condominium owners own their unit as real estate, and own an undivided share in the common areas of the building or complex. Condominiums offer some perceived advantages over cooperatives. Because each unit in a condominium is owned separately, there is less risk of losing the building if one owner defaults. And condominium owners have fewer decisions to make collectively, because only the common areas are owned jointly. On the other hand, since most housing is stratified by price, owners of both cooperatives and condominiums tend to be relatively homogeneous. They usually have a long-term commitment to their housing. These two factors help to mitigate the costs of participating in governance of both cooperative corporations and condominium associations.
Housing cooperatives are governed democratically, with each unit receiving a vote, regardless of size. Most cooperatives elect a board of directors to establish budgets, hire staff and enact policies. Bylaws and policies govern important issues like how membership shares are transferred and membership rules. Cooperatives may require that perspective buyers apply to the board of directors or a membership committee before the sale is completed. These rules and policies are consensual, since they are in the governing documents, rather than dictated by law.
Like all housing, cooperatives are financed through a combination of loans and equity. Cooperative owners will usually contribute some equity toward the purchase of their share, and may also obtain “share loans”, which function like a mortgage loan. In addition, the cooperative corporation may have a mortgage that covers the initial construction cost or remodeling. Cooperative owners pay a share of this mortgage as part of their monthly fee, and the interest is deductible under IRS rules.
The goal for this sector was to identify every housing cooperative in the U.S. and gather relevant data to determine the economic impact of this sector. We consulted experts in housing cooperatives who advised that we should gather data on property assessments and property taxes paid, but that these values might not be consistent, since assessment and taxing practices vary by municipality.
We conducted two concurrent searches for information. We compiled a list of individual housing cooperatives and we searched for state data on the total number of cooperatives and units. Collecting survey data from housing cooperatives was difficult. From a random sample of 600 cooperatives, we located 300 valid phone numbers, which yielded 32 completed surveys. We sent email requests and advertised the survey on several websites, but had very poor response.
We collected estimates from housing cooperative experts on the distribution of cooperatives across the country. Housing cooperatives developed in regional clusters, with 90% of the cooperatives located in 10 states, plus Washington, DC. We focused on these states, contacting regional housing associations, local experts, and the NCB (formerly National Cooperative Bank) [26] for more detail. Since tax and assessment data is held by local governments, we attempted to contact these organizations, but we were not able to search those listings by cooperative status.
Here we provide a brief overview of existing studies that report on the potential impacts of the housing sector. These studies often focus on the economic activity associated with new home construction and redevelopment. An annual Florida study uses a more complex analysis to value residential real estate in the Florida economy, using four impacts. The authors use IMPLAN [27] to measure the impact of construction, plus real estate transactions. In addition, they report on property taxes paid, and the explicit and implicit investment returns for real estate property owners (White, 2006 [28]).
The most significant challenge in obtaining similar data for cooperatives is the lack of uniformity in reported property values. Jurisdictions vary in how they value cooperatives for property taxes, and there may be significant differences between the assessed, appraised, and market values may differ significantly. A Florida study used aggregated data at the county and state level, but cooperative housing valuations must be collected by building. This can be challenging. For example, survey respondents might not know if their jurisdiction discounts property tax assessments, or the value of that discount.
Most research on the impact of cooperative housing has focused on the value of the public investment in cooperative affordable housing. Susan Saegert investigated the impact of housing ownership form in >400 multi-family properties that were acquired by NYC for non-payment of taxes and then sold to tenant-owned cooperatives, nonprofits, and private landlords (Saegert, 1998 [29]). Her study found that cooperative ownership was positively associated with building quality, better safety and security, and more evidence of prosocial norms. Tenants with higher incomes and better education tended to stay in the cooperative and invest resources in improving their living conditions. Longevity of cooperative tenants was also noted in a Chicago study (Chicago Mutual Housing Network, 2004 [30]) and positively associated with community stability. A survey of middle income senior cooperative members had similar results. Members reported improved social contact, life satisfaction, sense of personal safety, and happiness after moving into the cooperative.
A small study in the 1990s used a different approach to analyze the impact of cooperative housing, by examining the effect of resident ownership on the variable aspects of housing costs. Researchers concluded that cooperative ownership significantly reduced operating costs (including marketing, administration, operating, and maintenance costs). Finally, another 1990s survey of members of senior housing cooperatives reported positive health impacts and greater happiness, life satisfaction, social contact, and personal safety from living in a cooperative(Nolan, 2001 [31]).
 [32]
[32]
While relatively few in number, cooperatives in the transportation sector encompass a broad range of functionality. Often members of cooperatives in this sector are other service organizations. The cooperatives may be organized to meet the demand for services in lower-density rural areas, or in areas that cross geographic jurisdictional boundaries. The cooperative may be created to meet specialized transport requirements of school districts or those with limited mobility. Cooperatives are also organized to offer transportation alternatives that reduce the number of car trips in an effort to address environmental and sustainability issues that accompany the heavy traffic demands of urban areas.
Cooperatives offer an organizational approach for scheduling and vehicle sharing that more cost-effectively meets specialized transportation needs. Public-private cooperative ventures have resulted in ride-share and shuttle programs that provide route-specific transportation services to members, and are frequently organized around commuting patterns of employees.
Car sharing, begun in Europe in the late 1980s, is another approach to car ownership that has used the cooperative model to provide services to members. As of July 2008, the U.S. has 18 programs, several of which are nonprofit member-governed organizations (Carsharing [33]). These consumer cooperative organizations purchase, maintain, and insure cars for use by members on an as-needed basis. Members pay a fee and must meet driving license and record requirements to participate.
Cooperatives also supply the specialized transportation-related needs of a wide variety of members, including truck drivers, owners of biodiesel vehicles, and bicyclists.
Taxi cab cooperatives usually are worker cooperatives organized to benefit the drivers who provide transportation services to paying individuals. Typically, taxi cab companies operate using independent contractors who often must provide their own vehicle or lease one from the company. A worker-owned cooperative may be organized to provide a variety of employee benefits, the potential for a share in company profits, and the right to participate in ownership decision-making.
Privately owned taxi companies may also form purchasing cooperatives to provide more efficient administrative services to its member businesses.
Many public governmental entities use cooperative programs to more cost-effectively provide transportation services, such as compliance programs for school districts, and to facilitate inter-agency coordination of transportation planning. As governmental entities, these fall outside the scope of this project. However, many cooperative ventures involving both governmental agencies and private organizations have been formed to provide specialized transportation services, or to tackle the environmental and regional planning issues that arise from delivery of transportation services. In these cases, a nonprofit corporation organized along cooperative lines is sometimes formed to manage these efforts.
Car share cooperatives occupy a small portion of the growing car share market, which is dominated by Zipcar [34], a privately owned, national business that merged in 2007 with Flexcar, another leading car share enterprise. Car share cooperatives often predated the entry into a local market by Zipcar [34], or exist in cities not served by a private company. The nonprofit cooperative model also more easily supports a broader educational and outreach mission to reduce traffic and raise awareness of the larger externalities associated with widespread car ownership. The nonprofit status also allows such cooperatives to receive outside grants and donations that can offset the significant start-up costs for such a venture. Another stated benefit of the cooperative model for car share enterprises is the local control it can provide in developing the car share option as part of the larger transportation plan.
Worker-owned taxi cooperatives comprise a small fraction of the approximately 6,300 companies that operate in the United States. Only 6% of taxicab operations have >100 vehicles in service, >80% of these companies operate fewer than 50 vehicles (Taxicab, Limousine & Paratransit Association [35]).
The transportation sector also encompasses a variety of enterprises, such as small-scale biodiesel fuel supply cooperatives or services to support increased bicycle use. In these cases, the cooperative model provides services in markets that are not sufficiently developed, or do not have sufficient margins to attract profit-driven businesses.
Depending on the type of goods and services being provided, the transportation sector contains several different types of cooperative organization.
Because the provision of transportation services exists in the realm of the public good, many transportation cooperatives are organized on a nonprofit basis, and are collaborations between nonprofit, businesses, or public transportation entities to provide services or to develop trip reduction programs.
Nonprofit status may make collaboration with governmental agencies more straightforward, thus making the cooperatives eligible for grants and donations, and promoting a broader educational mission that can reach more members. Many nonprofit cooperatives exemplify boundary issues described above, and the members may have varying degrees of control over the organization, depending on board structure and bylaw requirements.
Car share cooperatives are member organizations that span the boundary between nonprofit and cooperative. Member representation on the board may vary, and multiple member classes besides individual drivers may exist, including businesses that provide a car sharing service to employees, and non-driving members who may support the goals of the organization.
Worker-owned taxi cooperatives are owned by the taxi drivers who elect a board to oversee the cooperative’s strategic generation. The cooperatives are structured to provide employee benefits and patronage profit-sharing; membership requirements vary.
The data on transportation cooperatives was obtained from primary research. All economic data was obtained from survey work undertaken by the UWCC. The survey response rate for transportation is 31% and all reporting cooperatives provided us with 2007 fiscal year-end data. The data collection and survey methodology is discussed in detail in the Data Collection [13] section in the Appendix.
Table 4-3 shows that we have data for 13 transportation cooperatives and collectively these firms account for >$68M in assets, nearly $290M in sales revenue, and pay nearly $9M in wages. There are approximately 500 hundred employees and nearly 30,000 memberships. As Table 4-3.3 shows, by extrapolating to the entire population (49 firms) and adding indirect and induced impacts to this activity, transportation cooperatives account for >$567M in revenue, nearly 800 jobs, $20M in wages paid, and >$60M in valued-added income.
| Economic Impact | Multiplier | Units | Direct | Indirect | Induced | Total | |
|---|---|---|---|---|---|---|---|
| Revenues | 1.877 | million $ | 302 | 120 | 145 | 567 | |
| Total Income | 1.823 | 34 | 12 | 16 | 62 | ||
| Wages | 1.538 | 13 | 3 | 4 | 20 | ||
| Employment | 1.243 | jobs | 618 | 60 | 90 | 768 | |
The structure and scope of education cooperatives vary widely, reflecting the diversity of educational institutions in the U.S. Educational cooperatives may serve a collective purchasing function for educational institutions. Other cooperatives included in this sector directly deliver educational services to the children of parent members. A few are worker cooperatives, with teachers as member owners.
Public school districts are empowered by individual state statutes, creating many different organizational approaches to delivering educational services. State, county, municipal, and town governments, as well as independent school districts, may all have a role, depending on a given state’s legislative provisions.
More than 15,000 public school systems were identified in 2002 (U.S. Bureau of the Census, 2002. [37]). In 2005, public school systems encompassed >97,000 public elementary and secondary schools (U.S. Department of Education, Educational Institutions [38]). In addition to public schools, there are almost 29,000 private elementary and secondary schools, and 6,463 post-secondary institutions identified as participating in Title IV Federal financial aid programs. (U.S. Department of Education, Educational Institutions [38]). Another 1.1 million children were home schooled in 2003 (U.S. Department of Education, Homeschooling [39]).
The decentralized nature of the public educational system provides many opportunities to achieve purchasing efficiencies through cooperative arrangements. About 620 educational service agencies (ESAs) have been created in 42 states to more cost-effectively provide programs and services to member school districts (Association of Educational Service Agencies [40]). ESAs are frequently self-identified as “cooperatives” or “collaboratives”.
ESAs enable member districts to cost-share in programs such as special education and professional development, many of which may be state or federally mandated. ESAs may also perform a collective purchasing function by aggregating demand and negotiating more favorable contracts for a wide variety of supplies, and may streamline administrative costs associated with following mandated contract purchasing procedures.
There are also educational purchasing cooperatives that exist independent of state statute, and serve the college, university and private school markets, as well as school districts in states without ESAs. These cooperatives also aggregate demand, negotiate contracts that provide better terms for their members, and provide assistance in meeting public procurement requirements.
Education cooperatives also encompass schools that are organized using cooperative principles. Parents, as the members who use the school to educate their children, exercise control over that process by direct involvement in all aspects of the school’s operations, including its board.
Several teacher cooperatives exist within the educational sector. As worker cooperatives, they provide a greater degree of autonomy and control over how the teacher members practice their profession. In contrast to implementing an externally developed instructional program, teachers develop and execute an educational program as part of the contract between the teacher cooperative and a public charter school. The cooperative also provides administrative services and is responsible for both the financial and academic success of the school.
ESAs are nonprofit entities with memberships composed of school districts in a defined geographic location. Authorized by state statute, they are financed by some combination of payments from member districts and contract fees for service (Association of Educational Service Agencies [40]), and are also eligible to receive state and Federal monies. ESAs are governed by a representative board; however, as public entities, they are subject to regulations and oversight procedures required in the public procurement process. ESA structure is often dependent on state statute, and boards may include appointed officials from state or local governing bodies as well as elected or appointed representatives from participating member districts. Ex-officio members may also have authority over some decisions.
Other educational purchasing cooperatives may be associated with membership in an affiliated professional association. These organizations may be incorporated as cooperatives and operate on a cooperative basis, distributing patronage dividends or certificates of equity based on purchase volume. Those serving school districts not included in ESAs may be incorporated as nonprofit corporations, and have both elected and appointed members on their board.
Cooperative schools typically are incorporated as nonprofit, tax-exempt organizations, even if they are within the public school system. Parents of the children attending the school comprise the membership of the cooperative, and may be asked to contractually commit to classroom, administrative, and fundraising assistance, participate in general membership meetings, and elect a board of directors from the membership. The board may include other community stakeholders. In the case of charter schools, the school district or other appropriate government entity typically is represented on the board. Member financial obligations may vary, depending on the fundraising needs of the school, and whether it is private or public.
Teacher cooperatives are governed by an elected board of directors that may include school and at-large representatives as well as educators. Given that teachers are public employees and may have significant benefits, in some cases teachers have maintained their public employment status while being a member of a teacher cooperative.
Some ESAs self-identify as cooperatives or collaboratives, and all ESAs use a representative board governance structure to achieve mutually beneficial cost-savings for members. However, the degree to which ESA boards are subject to public oversight and reporting pose questions about their classification as cooperatives.
The list for education cooperatives come from primary research. The decision to include ESAs was made after population discovery was complete. As a result, some self-identified ESAs are included, but the list of ESAs is not comprehensive. Further research may examine more closely the nature of collaborative government entities in sectors such as education.
All economic data was obtained from survey work undertaken by the UWCC and Guidestar [17]. The survey response rate for education cooperatives was 30.6% and all reporting cooperatives provided us with 2007 fiscal year-end data. The data collection and survey methodology is discussed in detail in the Data Collection [13] section in the Appendix.
Table 4-3 shows that we have data for 121 education cooperatives and collectively these firms account for >$428M in assets, nearly $700M in sales revenue, and pay >$300M in wages. There are nearly 10,000 employees and nearly 15,000 memberships. As Table 4-3.4 shows, by extrapolating to the entire population (390 firms) and adding indirect and induced impacts to this activity, education cooperatives account for >$1B in revenue, nearly 15,000 jobs, >$500M in wages paid, and nearly $700M in valued-added income.
| Economic Impact | Multiplier | Units | Direct | Indirect | Induced | Total | |
|---|---|---|---|---|---|---|---|
| Revenues | 1.757 | million $ | 753 | 254 | 316 | 1,323 | |
| Total Income | 1.783 | 373 | 124 | 168 | 665 | ||
| Wages | 1.458 | 350 | 72 | 88 | 510 | ||
| Industry Jobs | 1.291 | jobs | 11,017 | 1,286 | 1,923 | 14,226 | |
 [41]
[41]
Links:
[1] http://reic.uwcc.wisc.edu/health
[2] http://reic.uwcc.wisc.edu/house
[3] http://reic.uwcc.wisc.edu/transport
[4] http://reic.uwcc.wisc.edu/education
[5] http://reic.uwcc.wisc.edu/sites/all/social_public_coop_locations.jpg
[6] http://www.pbgh.org/
[7] http://www.tdi.state.tx.us/
[8] http://reic.uwcc.wisc.edu/ref#62
[9] http://www.ncba.coop/
[10] http://www.usworker.coop
[11] http://www.snhu.edu/7910.asp
[12] http://www.onesource.com/
[13] http://reic.uwcc.wisc.edu/survey
[14] http://reic.uwcc.wisc.edu/sites/all/healthcare_coop_locations.jpg
[15] http://reic.uwcc.wisc.edu/ref#59
[16] http://reic.uwcc.wisc.edu/ref#53
[17] http://www.guidestar.org/
[18] http://reic.uwcc.wisc.edu/sites/all/maps2/childcare_coop_locations.jpg
[19] http://reic.uwcc.wisc.edu/ref#46
[20] http://reic.uwcc.wisc.edu/ref#51
[21] http://reic.uwcc.wisc.edu/ref#47
[22] http://reic.uwcc.wisc.edu/ref#19
[23] http://www.nhclf.org/
[24] http://reic.uwcc.wisc.edu/ref#41
[25] http://reic.uwcc.wisc.edu/ref#9
[26] http://www.ncb.coop/
[27] http://reic.uwcc.wisc.edu/implan
[28] http://reic.uwcc.wisc.edu/ref#63
[29] http://reic.uwcc.wisc.edu/ref#45
[30] http://reic.uwcc.wisc.edu/ref#8
[31] http://reic.uwcc.wisc.edu/ref#42
[32] http://reic.uwcc.wisc.edu/reic/sites/all/housing_coop_locations.jpg
[33] http://reic.uwcc.wisc.edu/ref#7
[34] http://www.zipcar.com/
[35] http://reic.uwcc.wisc.edu/ref#48
[36] http://reic.uwcc.wisc.edu/sites/all/transportation_coop_locations_new.jpg
[37] http://reic.uwcc.wisc.edu/ref#50
[38] http://reic.uwcc.wisc.edu/ref#56
[39] http://reic.uwcc.wisc.edu/ref#57
[40] http://reic.uwcc.wisc.edu/ref#5
[41] http://reic.uwcc.wisc.edu/sites/all/maps2/education_coop_locations_new.jpg